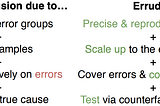
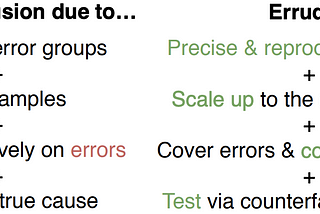
UW Interactive Data LabErrudite: Scalable, Reproducible, and Testable Error AnalysisError analysis is a compass, and we need it to be accurate.11 min read·Aug 12, 2019----
UW Interactive Data LabDraco: Representing, Applying & Learning Visualization Design GuidelinesFrom academic courses to online articles, discussions of visualization often abound with design guidelines: Don’t use pie charts! Don’t…9 min read·Oct 22, 2018----
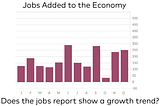
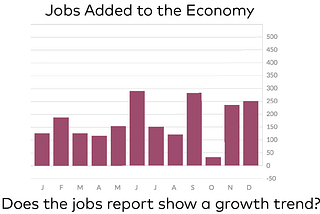
UW Interactive Data LabHypothetical Outcome Plots (HOPs) Help Users Separate Signal from NoiseIn daily life, we often find ourselves trying to separate signal from noise. For example, do the monthly job numbers to the left suggest a…7 min read·Oct 17, 2018----
UW Interactive Data LabValue-Suppressing Uncertainty PalettesThe real world is full of uncertainty, but it can be tough to communicate that uncertainty. This is especially true for data visualization…5 min read·Jun 19, 2018----
UW Interactive Data LabinHCI & Design at UWMultiple Perspectives on the Multiple Comparisons Problem in Visual AnalysisThe more visual comparisons an analyst makes, the more likely they are to find spurious patterns — a version of the Multiple Comparisons…10 min read·Apr 2, 2018----
UW Interactive Data LabIntroducing Vega-Lite 2.0We are excited to announce the official version 2 release of Vega-Lite, a high-level language for rapidly creating interactive…4 min read·Oct 31, 2017--2--2
UW Interactive Data LabinHCI & Design at UWExplaining the Gap: Visualizing One’s Predictions Improves Recall and Comprehension of DataWhat if Visualizations Asked Users to Predict the Data First?9 min read·Jul 11, 2017--1--1
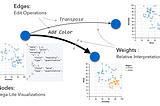
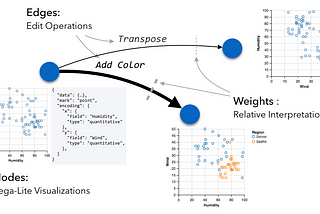
UW Interactive Data LabinHCI & Design at UWGraphScape: Modeling Similarity & Sequence among ChartsA single chart is often not enough to understand data and to convey a story. So it’s not surprising that people use multiple charts in…6 min read·May 23, 2017----
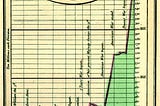
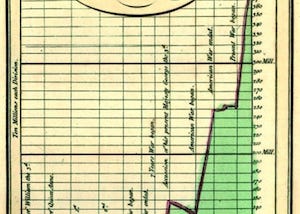
UW Interactive Data LabRegression by EyeWilliam Playfair was an early pioneer of information visualization. Here is one of his charts, a 1786 depiction of the national debt of…9 min read·May 2, 2017----
UW Interactive Data LabSurprise Maps: Showing the UnexpectedIn 1977, Jerry Ehman — an astronomer working with the SETI project to seek out alien life — came across an interesting radio signal, one…9 min read·Sep 27, 2016--1--1