V.ChawinGeographic Concentration of Major U.S. Food Chains (2023)The Geographic Concentration of Major U.S. Food Chains in 2023 reveals varying store distributions across the country. With 23,790…Dec 3, 2023Dec 3, 2023
V.ChawinMigratory Journey of Boreal Songbirds: A Year in MotionEvery year, an awe-inspiring natural spectacle unfolds as boreal songbirds embark on extraordinary journeys spanning thousands of…Oct 5, 2023Oct 5, 2023
V.ChawinDaily Mean Temperature of Zürich (Fluntern) 1901–1903 & 2017–2022The heatmap you are looking at provides an alternative viewpoint on Zürich’s climate by displaying daily mean temperatures from the…Sep 15, 2023Sep 15, 2023
V.ChawinVisualising Global Shipping Traffic Density (2015–2021)In this project, we examine global marine traffic, focusing on shipping density across the world’s oceans. This exploration is made…Jun 14, 2023Jun 14, 2023
V.ChawinWorldwide COVID-19 Vaccination Tracker: Unravelling Progress and DisparitiesIntroductionJun 2, 2023Jun 2, 2023
V.ChawinThe Vanishing Glaciers of the Swiss Alps: A GIS Analysis of Aletsch and TschiervaIntroductionJun 1, 2023Jun 1, 2023
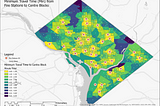
V.ChawinOptimizing Fire Service Accessibility in Washington, D.C.: A Geographic Information System AnalysisIntroductionMay 31, 2023May 31, 2023
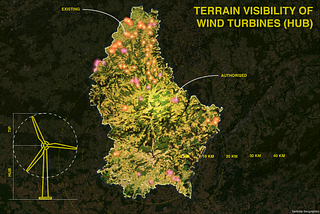
V.ChawinUtilising GIS Viewshed Analysis for Evaluating Wind Turbine Visibility in LuxembourgThe GIS data poster I have recently produced a comprehensive Viewshed analysis of wind turbines in Luxembourg. Using the ArcGIS Pro…May 31, 2023May 31, 2023
V.ChawinHistorical Typhoon & Cyclone Tracks in Southeast Asia Since 1945This map visualises the historical paths of typhoons and cyclones that have affected Southeast Asia from 1945 to the present day. With a…May 31, 2023May 31, 2023