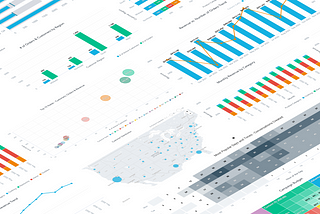
Vaclav KocianinGoodData DevelopersHow to Choose the Best Chart Type to Visualize Your Data in 2024Stop building exhibitions of charts. Start with the most important question and choose the best chart type for your data!Jul 17Jul 17
Vaclav KocianinGoodData DevelopersWireframes as a Communication ToolWhat is the best way to communicate between various parties on a complex technical project? A simple sketch!Jul 1Jul 1
Vaclav KocianinGoodData Developers5 Tips for Better Prototypes with GoodWireFive more tips to take your dashboard prototypes in Figma to the next levelJun 18Jun 18
Vaclav KocianinGoodData DevelopersGetting Started with GoodWire Wireframing Library7 tips to get you up to speed so you can hit the ground running on your next dashboard project!Jun 11Jun 11
Vaclav KocianinGoodData DevelopersIntroducing the GoodWire Wireframing LibraryTransform your prototyping with a comprehensive wireframing library for Figma. Designed specifically for prototyping data analytics…Jun 11Jun 11
Vaclav KocianinGoodData DevelopersPitfalls of Chat User Interfaces (not only) for Data AnalyticsLearn how to avoid the pitfalls of AI chat interfaces and harness the power of AI with a user-centered approach.Oct 26, 2023Oct 26, 2023
Vaclav KocianinGoodData DevelopersSix Principles of Dashboards’ Information ArchitectureDesigning a dashboard that users will love? Follow these 6 key information architecture principles to make data navigation a breeze.Jan 20, 2023Jan 20, 2023
Vaclav KocianinGoodData DevelopersHow to Choose the Best Chart Type to Visualize Your DataStop building exhibitions of charts. Start with the most important question and choose the best chart type for your data and your users.Dec 6, 20221Dec 6, 20221
Vaclav KocianinGoodData Developers7 Crucial Tips for Building Dashboards Users Actually Love To UseImagine yourself in a situation where you have a client who asks you to create a dashboard for them. What should you do? Where do you…Sep 26, 2022Sep 26, 2022