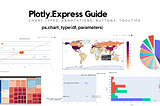
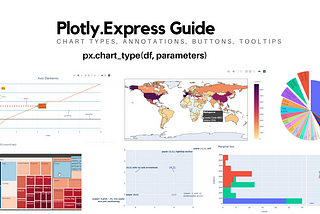
PinnedVaclav DekanovskyinTowards Data ScienceVisualization with Plotly.Express: Comprehensive guideOne dataset and over 70 charts. Interactivity and animation often in a single line of code.·24 min read·Oct 15, 2020--8--8
Vaclav DekanovskyCan AI teach us happiness?How to use the brain’s pattern recognition superpower to our benefit.·9 min read·Jan 31, 2021----
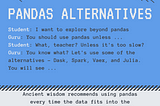
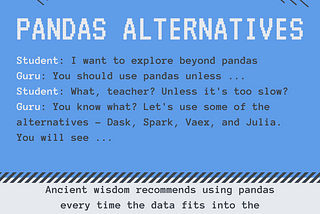
Vaclav DekanovskyinTowards Data ScienceIs something better than pandas when the dataset fits the memory?Explore Vaex, Dask, PySpark, Modin and Julia·10 min read·Jan 26, 2021--1--1
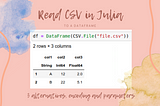
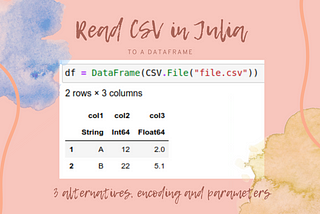
Vaclav DekanovskyinTowards Data ScienceRead CSV to Data Frame in Julia (programming lang)Parameters explained. Using CSV.jl, DataFrames.jl, dealing with StringEncodings.·8 min read·Jan 4, 2021--2--2
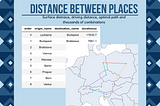
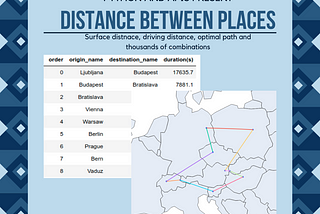
Vaclav DekanovskyinTowards Data ScienceDriving distance between two or more places in pythonAutomatic API calls, pandas manipulations, and traveling salesman problem·7 min read·Dec 7, 2020--2--2
Vaclav DekanovskyinTowards Data ScienceUnzip, update and zip again XMLs in a folder with pythonUse python to automate office routine·7 min read·Nov 3, 2020----
Vaclav DekanovskyinThe Travel HolidayWhy you should visit Omanpictures from the land of castles, canyons, and frankincense·6 min read·Oct 23, 2020--1--1
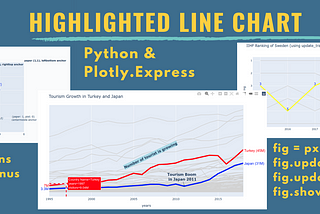
Vaclav DekanovskyinTowards Data ScienceHighlighted line chart with Plotly.ExpressEmphasize your point by highlighting lines over the grey background of other lines·10 min read·Oct 12, 2020--3--3
Vaclav DekanovskyinTowards Data ScienceUpsample with an average in PandasAlign inconsistently reported data for your machine learning·6 min read·Oct 9, 2020----
Vaclav DekanovskyinTowards Data ScienceHistograms with Plotly Express: Complete GuideOne dataset, over 60 charts, and all the parameters explained·15 min read·Oct 6, 2020--3--3