PinnedVinícius OviedoinStreamlitAnalyzing real estate properties with StreamlitA 7-step tutorial on how to make your own real estate appMay 16, 2023May 16, 2023
PinnedVinícius OviedoinDev GeniusThe Power of BoxplotBoxplots are statistical charts that allow obtaining a series of insights about data in a practical and visual way. Despite being simple…Mar 4, 20231Mar 4, 20231
PinnedVinícius OviedoinDev GeniusHow to setup matplotlib for storytellingA starting point to create beautiful charts that tell a storyJan 27, 2023Jan 27, 2023
PinnedVinícius OviedoinFAUN — Developer Community 🐾How I increased my freelancer incomes with dataReceipts increased by 235% since I introduced Data Analysis to my businessJul 21, 20225Jul 21, 20225
Vinícius OviedoData visualization on Surgical Site Infections (SSI) in CA, USACould you quickly identify facilities with poor performance regarding SSI?Oct 5, 2023Oct 5, 2023
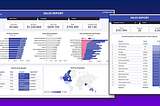
Vinícius OviedoThe value lies in the analysis, not the toolA Google Looker Studio exampleMay 7, 2023May 7, 2023
Vinícius OviedoinStreamlitCreating a Time Zone Converter with Streamlit6 steps on how to build your own converterApr 25, 2023Apr 25, 2023
Vinícius OviedoinFAUN — Developer Community 🐾Elevate Your Job Application GameAdvantages of Creating a Professional Cover Letter with LaTeXMar 30, 20231Mar 30, 20231
Vinícius OviedoThe truth about LaTeX tablesWhat tools like LATEX TABLES GENERATOR does not handleMar 7, 2023Mar 7, 2023
Vinícius OviedoThe Future of Audio Transcription: Balancing AI and Human TouchMaximizing Accuracy and Efficiency in Audio TranscriptionFeb 11, 2023Feb 11, 2023