PinnedBo Yuan, Ph.D.Golden Methods to Visualize Skewed DataKey Techniques to Unveil Hidden Patterns in Clustered DataJun 205Jun 205
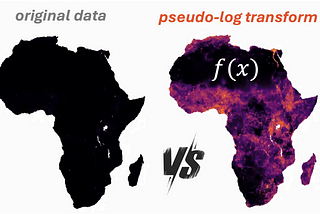
Bo Yuan, Ph.D.Pseudo-Logarithm in Data VisualizationA Mostly Unknown Yet Powerful Method for Data ProcessingJul 52Jul 52
Bo Yuan, Ph.D.What Publishing 27 Papers in Graduate School Has Taught MeTwo Simple Insights with Broad Implications for Career DevelopmentJun 28Jun 28
Bo Yuan, Ph.D.Create Elegant Animation of Population Pyramids with ggplot2 and gganimateIf you are not a member, you can read the full article by clicking here.May 19May 19
Bo Yuan, Ph.D.Create a Heatmap in R ggplot2 to Visualize the Control of Polio Disease by Vaccination in the U.S.If you are not a member, you can read the full article by clicking here.May 182May 182
Bo Yuan, Ph.D.Create a Heatmap in R ggplot2 to Visualize African Population DistributionIf you are not a member, you can read the full article by clicking here.May 7May 7