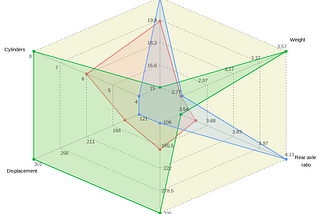
PinnedZvonimir BobaninTowards Data ScienceSpider and Parallel Charts in R with the ggvanced PackageAn R package for effective visualization of multiple variables5 min read·Jun 20, 2023----
PinnedZvonimir BobaninTowards Data ScienceWhen Is It Wrong to Use Bar Charts?…and possible ways to fix it8 min read·May 31, 2023--1--1
PinnedZvonimir BobaninTowards Data ScienceHow to Make a Spider Chart in R Using ggplot2A step-by-step construction of a spider/radar chart8 min read·Jan 11, 2023--3--3
PinnedZvonimir BobaninTowards Data ScienceDiving into the tidyverse using the Titanic data15 min read·Aug 30, 2022----
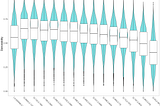
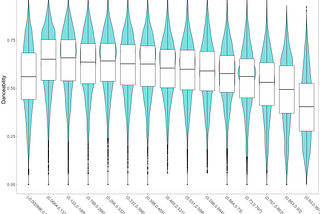
Zvonimir BobaninTowards Data ScienceAn Alternative Approach to Visualizing Feature Relationships in Large DatasetsHow to make those crowded scatterplots more informative5 min read·Sep 28, 2023--4--4
Zvonimir BobaninTowards Data ScienceTabyl — a frequency table for the modern R userOut with the old, in with the new!6 min read·May 20, 2023----
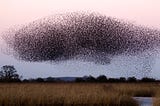
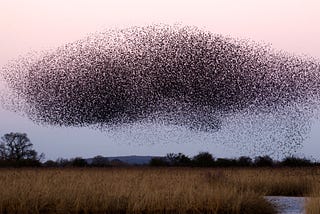
Zvonimir BobaninTowards Data ScienceHomo sapiens — the KNN classifierHow our decisions are governed by the KNN approach?5 min read·Sep 7, 2022--2--2
Zvonimir Boban“Birds of a feather flock together” — the story of the KNN classifierThe historical and theoretical introduction to the KNN algorithm with an implementation example in the R programming language.6 min read·Aug 20, 2022----