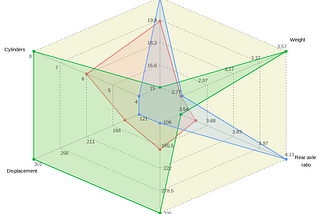
PinnedZvonimir BobaninTowards Data ScienceHow to Make an Advanced Spider Chart in PythonStep-by-step explanation with an easy to use function at the endSep 5Sep 5
PinnedZvonimir BobaninTowards Data ScienceSpider and Parallel Charts in R with the ggvanced PackageAn R package for effective visualization of multiple variablesJun 20, 2023Jun 20, 2023
PinnedZvonimir BobaninTowards Data ScienceWhen Is It Wrong to Use Bar Charts?…and possible ways to fix itMay 31, 20231May 31, 20231
PinnedZvonimir BobaninTowards Data ScienceHow to Make a Spider Chart in R Using ggplot2A step-by-step construction of a spider/radar chartJan 11, 20233Jan 11, 20233
PinnedZvonimir BobaninTowards Data ScienceDiving into the tidyverse using the Titanic dataAug 30, 2022Aug 30, 2022
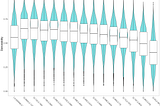
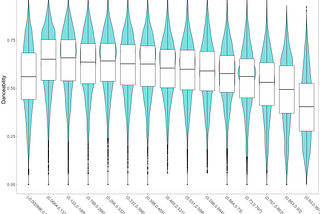
Zvonimir BobaninTowards Data ScienceAn Alternative Approach to Visualizing Feature Relationships in Large DatasetsHow to make those crowded scatterplots more informativeSep 28, 20234Sep 28, 20234
Zvonimir BobaninTowards Data ScienceTabyl — a frequency table for the modern R userOut with the old, in with the new!May 20, 2023May 20, 2023
Zvonimir BobaninTowards Data ScienceHomo sapiens — the KNN classifierHow our decisions are governed by the KNN approach?Sep 7, 20222Sep 7, 20222
Zvonimir Boban“Birds of a feather flock together” — the story of the KNN classifierThe historical and theoretical introduction to the KNN algorithm with an implementation example in the R programming language.Aug 20, 2022Aug 20, 2022