5 Machine Learning Algorithms for Beginners
Machine Learning! If you are updated with computer world you hear this term quite frequently nowadays. But what exactly is machine learning?
What is Machine Learning?
The term machine learning was popularized by Arthur Samuel.
In 1959, Arthur Samuel defined machine learning as, “The field of study that gives computers the ability to learn without being explicitly programmed”
Tom Mitchell defines machine learning as:
“ A computer program is said to learn from experience E with respect to some class of tasks T and performance measure P, if its performance at tasks in T, as measured by P, improves with experience E.”
These are some formal definition. So, what does these definition mean? Let me give you an example.
In traditional programming paradigm, to create an application, you write some algorithm to perform certain task. For simplicity, say a program to calculate square of a given number. You provide it data (for example, 2 as input). The program gives you output, in this case 4. This is how we typically write a program.
But in machine learning, we provide our program with data and output and the program automatically learns the algorithm. Amazing!

Now that you have some idea of what machine learning is, you might be wondering what are some of the algorithms used in machine learning. From my experience as beginner, it was confusing how to start. The world of machine learning is so vast you get lost just searching for these stuffs. It is like searching for a book in a library where books are kept at random order.
To help you guys with this situation, this article talks about 5 algorithms every beginners should know, in no particular order:
Linear Regression

Linear Regression is a machine learning algorithm based on supervised learning. It performs a regression task. Regression models a target prediction value i.e. value of dependent variable based on independent variables.
Equation of linear regression where y is dependent variable and x is independent variable. Theta1 and theta2 are parameters of equation.

Linear Regression is used when there is linear relationship between dependent variable and one or more independent variable. Independent variables is used to predict the value of dependent variable.
Application:
- To generate insights on consumer behaviours, understanding business and factors that influences profit
- To assess risk in financial service
- OLS regression can be used in weather data analysis. (More about this here)
- To understand market trends
- It is used in observational astronomy.
Logistic Regression
Logistic Regression is almost similar to linear regression. Logistic Regression is used when the dependent variable is binary, where as linear regression is used when the dependent variable is continuous.
Equation of logistic regression where y is dependent variable, x is independent variable and e is Euler’s number.

The above equation is known as logistic function or sigmoid function. It is an S-shaped curve that takes any real-valued number (in this case, x) and map it into a value between 0 and 1, but never exactly at those limits. Let’s look at the graph of sigmoid function.

Note the following things from the graph
- If the curve goes to positive infinity, y becomes 1.
- If the curve goes to negative infinity, y becomes 0.
- All other values are squashed between 0 and 1.
Logistic Regression predicts the probability of occurrence of a binary event using sigmoid function.
Application
- Gender Classification
- Predict mortality in injured patients
- Predict risk of developing given disease (example, diabetes, coronary heart disease) based on observed characteristics of patient
- To predict of customer’s propensity to purchase a product or halt of subscription
- Predict the likelihood of a homeowner defaulting on a mortgage.
Decision Trees

A decision tree is upside down tree with root node at top. It has three key parts; a root node, leaf nodes and branches.
Definition of decision tree according to Wikipedia
A decision tree is a flowchart-like structure in which each internal node represents a “test” on an attribute (e.g. whether a coin flip comes up heads or tails), each branch represents the outcome of the test, and each leaf node represents a class label (decision taken after computing all attributes). The paths from root to leaf represent classification rules.
Decision trees are simple yet powerful machine learning algorithm for both classification and regression task. Decision trees can also be used in multi-output problems and non linear relationships between parameters do not affect tree performance.
To learn more about decision tree, I recommend you guys to watch this video about Decision Tree from StatQuest with Josh Starmer.
Application
- Gender Classification from given sets of features (eg. age, height, weight, build, etc.)
- Identification of benign and malignant cancer cells.
- To determine the species of an animal
- To predict the price of house from given sets of features (eg. location, size,etc.)
- Identifying features to be used in implantable devices
Random Forests
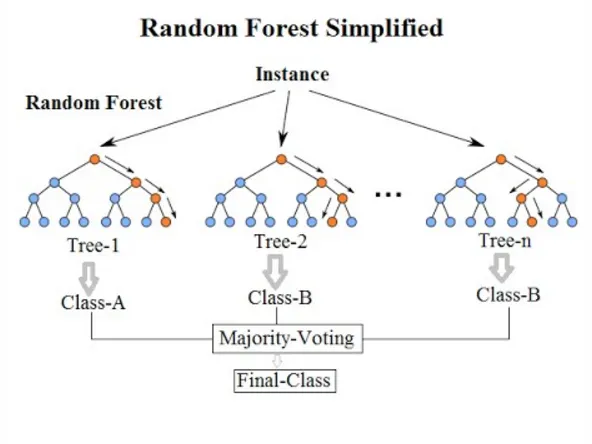
Random forests or random decision forests are an ensemble learning method for classification, regression and other tasks that operates by constructing a multitude of decision trees at training time and outputting the class that is the mode of the classes (classification) or mean prediction (regression) of the individual trees. They are fast, flexible and represent a robust approach to mining high-dimensional data.
Random forests are essentially a collection of many decision trees. A random forest typically have a number of trees between 30–130 but it depends of the type of data and problem statement.
Random forest run times are quite fast and they are pretty efficient in dealing with missing and incorrect data. This is one of the most frequently used algorithm in kaggle competition (If you don’t know about kaggle, search for it). The downside that they may overfit datasets that are particularly noisy.
Application
- Fraud detection for bank accounts, credit card.
- Anomaly detection
- Identification of given disease in patient by analyzing their medical records
- Predict price of house given sets of features
Support Vector Machine (SVM)

In machine learning, support-vector machines (SVMs, also support-vector networks) are supervised learning models with associated learning algorithms that analyze data used for classification and regression analysis. Given a set of training examples, each marked as belonging to one or the other of two categories, an SVM training algorithm builds a model that assigns new examples to one category or the other, making it a non-probabilistic binary linear classifier.
The idea of SVM is simple: create a line or a hyperplane which separates data into multiple classes. Although it can be used in regression problem, it is mostly used for classification technique.
Support Vector Machine performs classification by finding the hyperplane that maximized the margin between the two classes. The vectors that define the hyperplane are called the support vectors.
One of the benefits of SVM is in addition to performing linear classification, it can also efficiently perform non-linear classification using kernel trick, by mapping the inputs into high-dimensional feature spaces.
Application
- To categorize text and hypertext
- To classify images
- To recognize hand written digits
- To classify types of proteins.
- For geospatial and spatiotemporal environmental data analysis and modeling series.
You can learn about these algorithms from StatQuest with Josh Starmer.
Thank you for reading! I hope you enjoyed this article. Do let me know if you have any queries. Happy machine learning!