
A Comprehensive Guide To Loss Functions — Part 1 : Regression
Loss functions are used to calculate the difference between the predicted output and the actual output. To know how they fit into neural networks, read :
In this article, I’ll explain various loss functions for regression, their advantages, and disadvantages using which, you can select the right one for your project.
Let’s begin, shall we?
Loss functions are fundamentally dependent on the nature of our dependent variables and so, to select a loss function, we must examine if our dependent variables are numeric (in regression task) or probabilistic (in a classification task).
Loss functions for regression :
When we are dealing with numeric variables, we have to measure the losses numerically, meaning, just knowing if the predicted value is wrong is not enough, we have to calculate the amount of deviation of our prediction from the actual value, so we can train our network accordingly.
The different loss functions for this are :
- Mean Absolute Error (MAE).
- Mean Absolute Percentage Error (MAPE).
- Mean Squared Error (MSE).
- Root Mean Squared Error (RMSE).
- Huber Loss.
- Log-Cosh Loss.
Mean Absolute Error (MAE) :
MAE is the simplest error function, it literally just calculates the absolute difference (discards the sign) between the actual and predicted values and takes it’s mean.
Mathematical Equation :

Graph :
The following figure shows that the MAE increases linearly with an increase in error.

Advantages :
- MAE is the simplest method to calculate the loss.
- Due to its simplicity, it is computationally inexpensive.
Drawbacks :
- MAE calculates loss by considering all the errors on the same scale. For example, if one of the output is on the scale of hundred while other is on the scale of thousand, our network won’t be able to distinguish between them just based on MAE, and so, it’s hard to alter weights during backpropagation.
- MAE is a linear scoring method, i.e. all the errors are weighted equally while calculating the mean. This means that while backpropagation, we may just jump past the minima due to MAE’s steep nature.
Mean Absolute Percentage Error (MAPE) :
MAPE is similar to that of MAE, with one key difference, that it calculates error in terms of percentage, instead of raw values. Due to this, MAPE is independent of the scale of our variables.
Mathematical Equation :

Graph :
The following figure shows that the MAPE also increases linearly with an increase in error.

Advantages :
- Loss is calculated by normalizing all errors on a common scale (of hundred).
Disadvantages :
- MAPE equation has the expected output in the denominator, which can be zero. Loss cannot be calculated for these, as division by zero is not defined.
- Again, division operation means that even for the same error, the magnitude of actual value can cause a difference in loss. For example, if the predicted value is 70 and the actual value is 100, the loss would be 0.3 (30%), while for the actual value of 40, the loss would be 0.75 (75%), even though the error in both the cases is the same, i.e. 30.
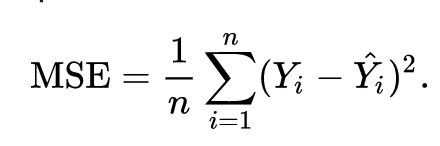
Mean Squared Error (MSE) :
In MSE, we calculate the square of our error and then take it’s mean. This is a quadratic scoring method, meaning, the penalty is proportional to not the error (like in MAE), but to the square of the error, which gives relatively higher weight (penalty) to large errors/outliers, while smoothening the gradient for smaller errors.
Mathematical Equation :

Graph :
The above figure shows that the MSE increases exponentially with an increase in error.

Advantage :
- For small errors, MSE helps converge to the minima efficiently, as the gradient reduces gradually.
Drawback :
- Squaring the values does increases the rate of training, but at the same time, an extremely large loss may lead to a drastic jump during backpropagation, which is not desirable.
- MSE is also sensitive to outliers, i.e. outliers in data may impact our network more, as the loss for these will be considerably higher.
Root Mean Squared Error (RMSE) :
RMSE is just the square root of MSE, which means, it is again, a linear scoring method, but still better than MAE as it gives comparatively more weightage to larger errors.
Mathematical Equation :

Graph :

Advantages :
- Less extreme losses even for larger values.
- More sensitive to outliers than MAE.
Disadvantage :
- RMSE is still a linear scoring function, so again, near minima, the gradient is sudden.
MAE vs MSE vs RMSE vs MAPE :

Huber Loss :
Huber loss is a superb combination of linear as well as quadratic scoring methods. It has an additional hyperparameter delta (δ). Loss is linear for values above delta and quadratic below delta. This parameter is tunable according to your data, which makes the Huber loss special.
Mathematical Equation :

Graph :
The following figure shows the change in Huber loss for different values of the δ against error.

Advantages :
- Modifiable hyperparameter delta (δ).
- Linearity above delta ensures fair weightage to outliers (Not as extreme as in MSE).
- Curved nature below delta ensures the right length of steps during backpropagation.
Disadvantages :
- Due to additional conditionals and comparisons, Huber loss is comparatively expensive in terms of computations, especially if your dataset is large.
- To get the best results, δ also needs to be optimized, which increases training requirements.
Log-Cosh Loss:
Graphically, Log-cosh is quite similar to Huber loss as it is also a combination of linear and quadratic scorings. One difference that sets this apart is that it is double differentiable. Some optimization algorithms like XGBoost prefer such functions over Huber, which is differentiable only once. Log-cosh calculates the log of hyperbolic cosine of the error.
Mathematical Equation :

Where, p = predicted value and t = true value.
Graph :

Advantages :
- Double Differentiable.
- Comparatively less computations required (than Huber).
Disadvantages :
- Less adaptive than Huber as it follows a fixed scale (no δ).
MSE vs Huber vs Log-Cosh :

Mega comparison of loss functions:

These are the most common loss functions used for regression. There are other loss functions like quantile loss and Poisson loss, but in my opinion, these should be enough to get started. One can also design and implement their own custom loss functions that are specific to their use case. Sometimes, a combination of these loss functions is also used.
I’ll be covering loss functions for classification algorithms in my next article.
Thank you for reading. Any feedback/suggestions are appreciated.
Also Read :
More about me:
GitHub: https://github.com/Rohan-Hirekerur
LinkedIn: www.linkedin.com/in/rohan-hirekerur
Twitter: https://twitter.com/Youthful96
