Understanding PPO Plots in TensorBoard
OpenAI Baselines and Unity Machine Learning have TensorBoard integration for their Proximal Policy Optimization (PPO) algorithms. It’s helpful to plot and visualize as much as possible in Reinforcement Learning (RL). Doing so can aid in debugging, lead to better insights, find things to explore, and highlight problems. This post will summarize the default plots, try to provide explanations, and ask for help in trying to understand some of the metrics plotted.
Unity PPO

Unity provides an explanation of its PPO implementation with TensorBoard, a sample image of the plots (see above), an explanation for each plot (sometimes an alternate explanation), and what to look for. Below are the aggregated explanations with alternate explanations italicized.
- Lesson — Plots the progress from lesson to lesson. Only interesting when performing curriculum training.
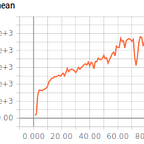
- Cumulative Reward — The mean cumulative episode reward over all agents. Should increase during a successful training session. The general trend in reward should consistently increase over time. Small ups and downs are to be expected. Depending on the complexity of the task, a significant increase in reward may not present itself until millions of steps into the training process.
- Entropy — How random the decisions of the model are. Should slowly decrease during a successful training process. If it decreases too quickly, the
betahyperparameter should be increased. This corresponds to how random the decisions of a Brain are. This should consistently decrease during training. If it decreases too soon or not at all,betashould be adjusted (when using discrete action space). - Episode Length — The mean length of each episode in the environment for all agents.
- Learning Rate — How large a step the training algorithm takes as it searches for the optimal policy. Should decrease over time. This will decrease over time on a linear schedule.
- Policy Loss — The mean magnitude of policy loss function. Correlates to how much the policy (process for deciding actions) is changing. The magnitude of this should decrease during a successful training session. These values will oscillate during training. Generally they should be less than 1.0.
- Value Estimate — The mean value estimate for all states visited by the agent. Should increase during a successful training session. These values should increase as the cumulative reward increases. They correspond to how much future reward the agent predicts itself receiving at any given point.
- Value Loss — The mean loss of the value function update. Correlates to how well the model is able to predict the value of each state. This should increase while the agent is learning, and then decrease once the reward stabilizes. These values will increase as the reward increases, and then should decrease once reward becomes stable.
OpenAI Baselines PPO


Unlike Unity, there is not a formal guide for these measurements. John Schulman’s excellent lecture addresses some of these and the Baselines code addresses others. For the rest, the explanations are the best of my understanding.
- approxkl — Approximate Kullback–Leibler divergence measure of the old policy from the new policy. I’m not sure how to diagnose this or why they are using an approximation instead of the actual KL. Maybe this metric works the same as how Schulman recommended using KL:

- policy_loss — The loss of the policy gradients part of PPO. This along with the KL loss (optional), value function loss and entropy regularization make up the loss for PPO. Also see Unity section.
# Calculate ratio (pi current policy / pi old policy)
ratio = tf.exp(OLDNEGLOGPAC - neglogpac)
# Defining Loss = - J is equivalent to max J
pg_losses = -ADV * ratio
pg_losses2 = -ADV * tf.clip_by_value(ratio, 1.0 - CLIPRANGE, 1.0 + CLIPRANGE)
# Final PG loss
pg_loss = tf.reduce_mean(tf.maximum(pg_losses, pg_losses2))- clipfrac — Fraction of times the clip range hyperparameter is used. PPO clips the new policy within the clip range of the old policy, allowing stable learning. I’m not sure what to look for in plots of this (other than for guidance in choosing the clip range hyperparameter).

# Calculate ratio (pi current policy / pi old policy)
ratio = tf.exp(OLDNEGLOGPAC - neglogpac)
clipfrac = tf.reduce_mean(tf.to_float(tf.greater(tf.abs(ratio - 1.0), CLIPRANGE)))- eplenmean — episode length mean.
- eprewmean — episode reward mean.
- explained_variance — Calculates if value function is a good predicator of the returns (ev > 1) or if it’s just worse than predicting nothing (ev =< 0). The formula:

# Calculate the fps (frame per second)
fps = int(nbatch / (tnow - tstart))- nupdates — Timesteps divided by number of batches.
nupdates = total_timesteps//nbatch- policy_entropy — Some additional advice from an excellent blog post on engineering an RL experiment:

- serial_timesteps — update*nsteps. When multiple environments, this will be total_timesteps divided by number of environments.
- time_elapsed — Time elapsed in seconds.
- total_timesteps — number of timesteps (i.e. number of actions taken in the environment).
- value_loss — See Unity section.
Miscellaneous Notes:
- Though neither are plotted in Baseline’s PPO, learning rate and cliprange decay in a linear schedule based on total_timesteps parameter.
- Max entropy is when all actions are equally likely. Minimum entropy is when one action is selected every time. In a discrete problem, consider the number of actions your agent can select when choosing this parameter.
- There’s an interesting paper ‘Are Deep Policy Gradient Algorithms Truly Policy Gradient Algorithms?’ that questions are understanding of why PPO works. In particular, they find that learning rate annealing is necessary to achieve good performance with PPO despite the method not being a core part of PPO. Another finding regards the value network and function, calling into question our understanding of what the value network and function do. Thus possibly making our attempts to understand plots like value loss and value estimate an unrewarding task:
Our results (Figure 4a) show that the value network does succeed at both fitting the given loss function and generalizing to unseen data, showing low and stable mean relative error (MRE). However, the significant drop in performance as shown in Figure 4b indicates that the supervised learning problem induced by (17) does not lead to V π θ learning the underlying true value function.
4. In addition to not understanding what to look for in approxkl and clipfrac, I’m also not confident in what to look for in policy_loss, value_loss, and value estimate. The Unity notes provide some guidance, but as of yet I don’t feel confident to diagnose issues with PPO training by looking at these plots. Any further insights readers of this post have would be appreciated.