Fertility trends in Albania 1991–2011
In 1990, Albania was the country with the highest TFR (Total Fertility Rate) in Europe at around 3.0. Since the fall of the communist regime, the country has seen some dramatic demographic changes, as a result of both migration and decrease in fertility. In this post, we will focus more on the latter and how it has evolved through time and in various groups of the population.
Methodology
Using data from the 2008 civil registry as well as census microdata from 2011 (3% sample), we are able to link children to their mothers and thus get a fair estimation of the TFR of Albania during the period after 1990. We focus on this period not only because it represents the period after the fall of the communist regime, but also because everyone born after 1990 is still located in their parents household in the 2008 registry, thus allowing for perfect linkage for our purposes.
After linking almost every birth to their mother, we are then able to calculate the ASFR (Age Specific Fertility Rates) for women aged 15–49 in intervals of 5 years, and get a final estimate for the TFR, as shown in the formula below:

Validation
To measure the validity of our methodology, we compare the TFR curves reconstructed based on the civil registry and census microdata to the official TFR figures from INSTAT (the Albanian Institute of Statistics), as shown in the graph below.

The correlation for both methods to the INSTAT figures is around 0.96–0.97, so we can consider them as very good measures, although the civil registry will allow us for better analysis of subgroups simply due to it containing every Albanian citizen. Before calculating the TFR on the civil registry, I excluded probable migrants.
Regional variations
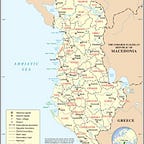
In terms of regional variabilities, we can calculate an aggregated version of TFR for the years spanning from 2000 to 2007, divided by the administrative unit of origin of the household head.

We can observe two distinct areas tha correspond to the highest and lowest values in the map: the eastern strip that composes most of the areas of the country with TFR above replacement level; and the southern Orthodox strip that contains the lowest values. The eastern strip includes the areas of Has, Kukes, Diber, Bulqize, Mat, Librazhd, and Pogradec. It corresponds to an area that is more socially and religiously conservative than the rest of the country. It is the area with the highest percentage of people declared as Muslim in the 2011 census, and includes the regions where Muslim first names are also found at a relatively higher share compared to the rest of the country.
Ethnic and religious variations
As for the southern strip, the TFR values in this part of the country were already just below 2.0 in 1990, and the emigration of the majority of the working age population has led to a demographic collapse. This is especially visible in areas inhabited by the Greek minority, but it also affects the rest of Southern Albania as well. These trends, along with data from the 2011 census, mean that Greeks might not be anymore the largest minority in Albania, being overtaken by the Romani and Egyptian minorities.
We can also take a look at fertility trends by religious background.

We can observe a higher TFR among the Catholics in the early 1990s. However, their TFR has converged with that of the Muslim population. While the Catholic show a higher average TFR, it is the Muslim groups in Eastern Albania that generally register the highest values in Albania. The values for the Orthodox population, on the other hand, show the clear demographic collapse of this group. These numbers generally complement my article about the demographic decline of this population, and it is highly likely that the 2023 census will show them at <6% of the general population, and probably <4% among newborns. The 2011 census microdata allows to look at TFR levels by self-declared religion and ethnicity.

There is a slightly smaller fertility rate among the irreligious and the Bektashi.
Socioeconomic variations
Albania is also a country where the demographic transition (decrease in fertility and increase in life expectancy) has had a high correlation with socioeconomic status. The data allows us to measure urban and rural fertility over the period.

We can observe that even in rural areas overall TFR had fallen below replacement rate by the end of the 2000s.
Using the socioeconomic index I have developed recently, as explained in my last article, we can also plot the TFR by socioeconomic percentile.

While the poorest quartile of the population still had a TFR above replacement level, the top 1% was below 1.0.
Tirana metro
Finally, we can also observe TFR levels in the capital region of Tirana. First of all, we see a significant difference in TFR between the city itself and the rest of the region.

The lowest values were in Unit 10 (historical center of the city), and Unit 5 (upscale area of the city including Blloku) at respectively 1.14 and 1.21. The highest values were in Unit 6 (Kombinati, the working class district of the city), and Unit 11 (Lapraka, an area that has seen an influx of northern migrants) at respectively 1.73 and 1.75. Outside the city limits, the units of Dajt, Farke, and Kashar have sub replacement levels, as these correspond to urban suburbs that have recently developed as extensions of the city, while the rest of the region, including the rural areas and Kamez (a recently urbanized area with a high percentage of migrants from rural northern areas) register the highest values.
Conclusion
In conclusion, Albania had completed its demographic transition by the early 2000s and the TFR figures stabilized at around 1.6, until they started falling again since the mid 2010s to reach the current level of 1.4. We will need to wait the completion of the new census this year to learn more precisely about the demographic developments since 2011. It is possible that recent decrease in TFR may simply be due to migration not being accounted for in the latest population figures.