Building in-house map service at Eats
Three stages of delivery time estimation and route planning for food delivery at cheetah speed
By Huang Ciyin, Yong Sun, Daxin Guang

This post is also available in Korean.
From delivery routes planning to predicting order arrival times, an accurate map service is essential to the Coupang Eats business. Eats previously relied on third-party map service vendors, but they fell short of our growing business, which required customized map features and improved UX requirements.
Committed to bringing our customers the “Wow” experience, we decided to embark on a journey to design and develop our in-house map service. In this post, we discuss the directions service, a core component of our in-house map services, to illustrate how we improved efficiency and saved millions of dollars in operation costs.
Table of contents
· Location services at Eats
· Limitations of third-party maps
· In-house map and directions services
· Stage 1: Training algorithm models to calculate ETA
· Stage 2: Calculating way speed by data mining
· Stage 3: Optimizing directions by using POI
· Conclusion
Location services at Eats
When customers use the Eats app, they simply pick out a menu and enter their address for food delivery right to their door. However, in those fleeting moments, Eats is making complex calculations on the back end using intricate location technology. Here are just a few ways how:
- Calculating delivery routes. Eats delivery partners (EDP) travel via motorcycle, car, bike, and foot to find the optimal delivery route for each mode of transportation respectively.
- Calculating the estimated arrival time (ETA). Even on the same route, the ETA can drastically differ due to traffic or weather conditions. Accurate ETA helps us find the optimal delivery route.
- Identifying an optimal entrance for delivery. Customers can order food to a park or to a specific building. Large areas, such as an apartment complex, are referred to as an area of interest (AOI). An important work is to identify the optimal entrance point of the AOI and guide the EDP to the nearest entrance.
The target of all the above calculations is to find an optimal route for EDP and make the food delivery more efficient, to pursue a win-win CX.

Limitations of third-party maps
While all the mentioned map use cases were met on a basic level using third-party services, we faced some issues and limitations during the rapid development of Eats business.
- Inefficient. Third-party maps did not reliably provide accurate route path and ETAs. Furthermore, we found that third-party maps would often assign EDPs to non-optimal routes or incorrectly POIs (point of interest).
- Unstable. Using third-party maps results in high latency and long mean time to repair (MTTR). Because map services are critical to our business, such unstable performance issues became detrimental to customer experience.
- Unscalable. Dependency on third-party apps also limited our business scalability. Queries per second (QPS) restrictions limited our ability to respond quickly to growing customer orders.
In-house map and directions services

To overcome the problems of using third-party maps, we created our in-house map services. Commonly, map services heavily rely on data, and the in-house map services are split into 3 layers: online services layer, data layer, and data producer layer. We also leverage a machine learning platform to improve the data accuracy.
A core component of the in-house map is the directions service, which is responsible for route planning, calculating ETA and distance, and more. The following sections detail the three key stages we went through while developing the directions service.
Stage 1: Training algorithm models to calculate ETA
During the first stage of the development of the directions service, we focused on creating a system that could improve our ETA accuracy.
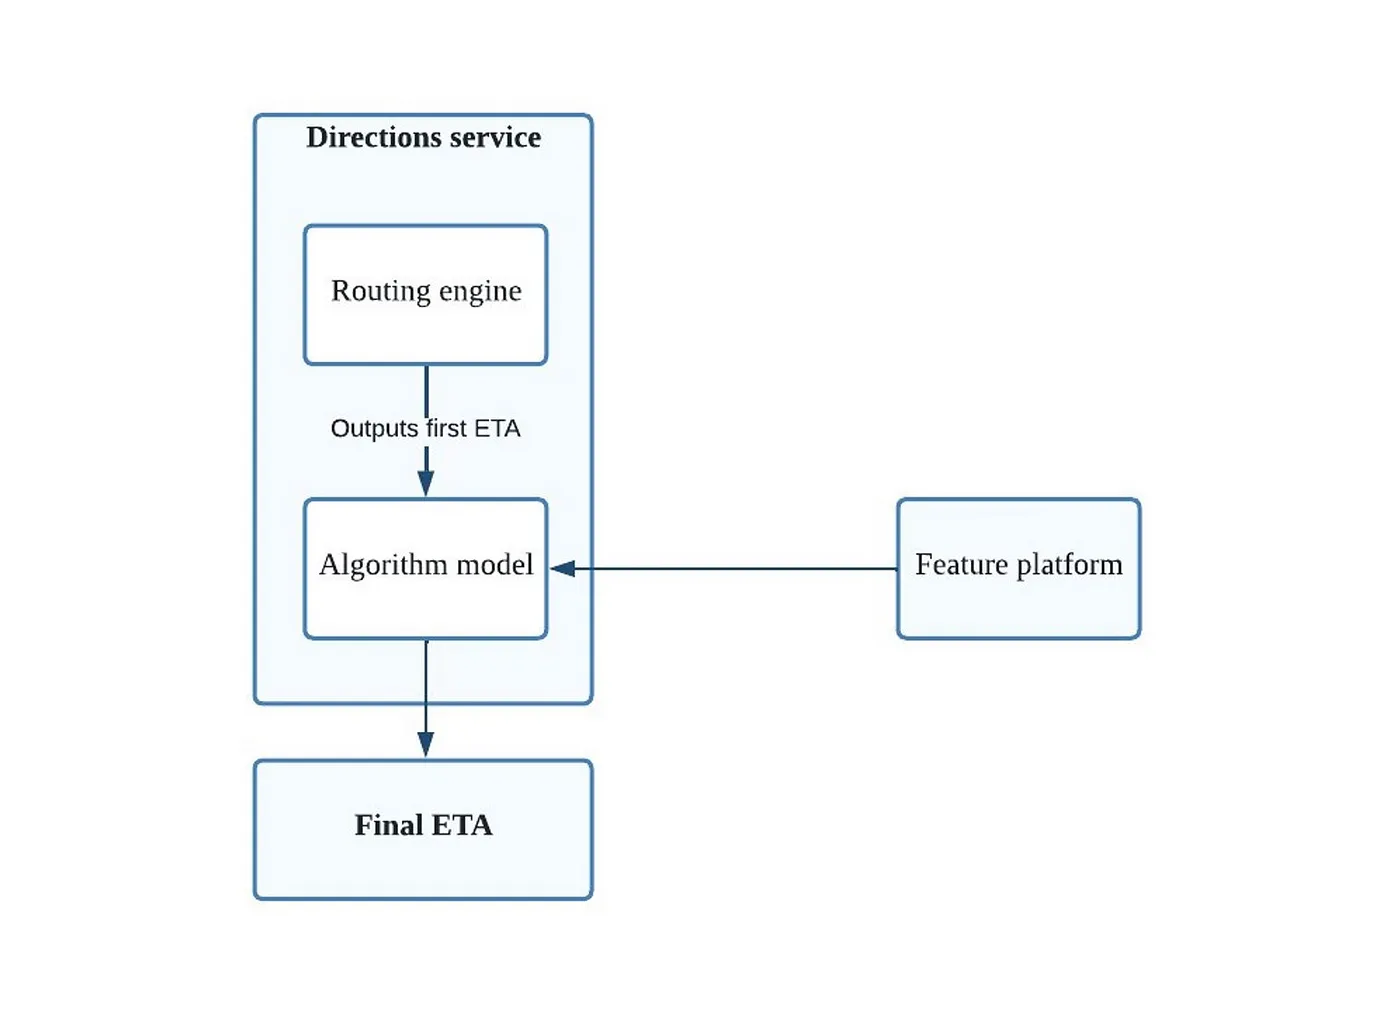
First, a routing engine was built to calculate the ETA. However, because we were starting from zero, there was less data to work with and the results were not very accurate. To improve accuracy, an algorithm model was trained based on business features, such as historical EDP track data, vehicle type, delivery region info, and so on.
Statistically, the result of the algorithm model and routing engine were not bad. However, they could not reflect real-time changes, such as traffic. Also, we saw a few poor results due to distribution.
Stage 2: Calculating way speed by data mining
To improve ETA calculations and route planning, the speed with history traffic is produced by data mining based on business data. The mined speed is attached to road segment and used to calculate route weighting and ranking while planning.

Segment speed calculations
There are two methods to obtain speed from EDPs:
- Speed calculated from distance. A segment is the smallest granularity of the road. A track is the EDP’s delivery route, and track points are a series of EDP location data for a given segment. The distance between two track points and the delta time of the two track points are uploaded. The accuracy of the speed depends on the accuracy of delta time, which is obtained through the EDP app.
- Speed uploaded by GPS of the EDP. GPS speed is accurate when the EDP is traveling on a road without tall buildings on either side. But if the EDP is traveling between tall buildings, the GPS signal is impacted, and the uploaded speed is inaccurate.
We use a combination of both these speed calculations methods to obtain an accurate segment speed used for ETA calculation and route planning.
Map matching and noise filtering
To make precise speed calculations, we first map the EDP route through map matching, which converts geographic coordinates to a road segment in the real world. Map matching helps us to filter out the inaccurate locations and find the target road segment.

After map matching, we preprocess the route for speed calculations by adding or filtering track points using point density:
- If the travel time between two points is too long, then the track is split into two sub-tracks.
- If the travel time between two points is too short for cars or motorcycles, the points are defined as noise and are removed.
- If there are too few points in a track, the track is removed.
For example, in the below picture, there are EDP track points map-matched on three segments. The points marked by the circle and ellipse are removed because the travel time between them is too insignificant and they are defined as noise.

After noise filtering, we calculate the overall speed of the route. The detailed formula can be seen below, where V is speed and Vxi is speed between track points, calculated by distance and duration between point i and i+1. First, we calculate the average of Vi as the final speed on a segment. Then, to smooth the deviation among Vxi, we add more speed data, denoted as Vyj, to calculate the final speed. We use these speeds to derive the duration of each segment, the final travel duration, and the ETA.


Stage 3: Optimizing directions by using POI
If the point of interest (POI) is one building in a large apartment complex (AOI) with multiple entrances, we want to determine the optimal waypoint for the EDP to minimize delivery time, taking into consideration the EDP’s mode of transportation. Such nearby destination directions have a large impact on the entire Eats delivery scenario.
If the EDP delivers by car, the route must be planned to lead to a suitable parking spot for the EDP. If there are more than one entrances into the AOI, the route must be planned that the waypoint leads to the entrance closer to the POI. If the EDP is delivering to a large park, the route for the EDP to the customer is as simple as possible because of the high possibility that the POI doesn’t exist in the park.

To find accurate waypoints, we use the following methods:
- POI data. We use data from previous EDP deliveries, satellite pictures, and other data to determine the best waypoint for the EDP and improve ETA accuracy.
- Spatial index. We split up the AOI into small cells and built a spatial index by cell that can be quickly queried. Below is a park that we divided into small cells. By placing the customer in a small cell, we can easily determine the nearest entrance as the waypoint for the EDP, reducing delivery time.

Performance and cost
After switching to our in-house directions service from third-party services, we saw the following achievements:
- The P99 latency of the directions service was reduced by 70% (from 350ms to 100ms). After follow-up optimization, P99 is under 50ms.
- The system scalability bottleneck has been resolved. Currently, the directions service handles 10 times more traffic than before, with P99 latency under 50ms.
- Engineering costs have decreased by about $2 million annually.
- Business metrics, such as total delivery time, EDP wait time for food, and operating costs, have all improved. User experience metrics have also seen improvements.

Conclusion
In this post, we provided you with a quick introduction to the in-house directions service used in Eats. However, a map system is complex and consists of many subsystems, and there are still lots of work to do. We are continuously evolving our flexible system to achieve successful design innovation and productivity for Eats and hope to share more updates in the future.
You are welcome to join us if you are interested in any of these complex problems, refer to our open positions.