Alaska Leads in Vaccination Rates
Weekly updates on the geography of COVID
By Kenna Camper
The U.S. has seen an overall decline in daily new cases over the last week. While the total number of COVID cases in the nation reached a staggering 26 million, the vaccine rollout continues (albeit with issues in the process) and there is hopeful news of the progress of a third vaccine moving closer to receiving emergency authorization from the FDA.
We highlight current vaccination trends below, but first look at the hotspot counties and regions where the virus is still spreading, inflecting, and resulting in the deaths of around 1,500 Americans per day. Unfortunately, we see a disparity between states with the highest vaccination rates and those where regional hotspots persist.
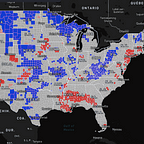
Regional Hotspots
Throughout this past week, Texas has remained a place of stable and emerging hotspots. Multi-county hotspots clusters have been present especially around Dallas, Tarrant, Maverick, Williamson, Montgomery, and Bell counties.
North Carolina and South Carolina have been locations of stable hotspots since January, with cases concentrated around the border between the two states — particularly in areas around Chester and Greenwood counties in South Carolina and Cabarrus and Union counties in North Carolina. Another multi-county cluster of hotspots has also been present near North Carolina’s Nash County.
With the Super Bowl last weekend, we saw crowds gathering and celebrating, often mask-less, in Tampa, as well as in the American households that bucked health officials’ warnings and held versions of the traditional Super Bowl Party. We will be watching how these trends play out over the next few weeks across different metrics.
Vaccination Data
As of February 6th, Alaska has the highest percent of doses administered at 14% for the first doses and 4.8% for the second. North Dakota, New Mexico, West Virginia, and Connecticut have the following highest percentages for the first dose at around 11% of their respective total populations. According to the CDC, a total of 1.4 million doses are being administered per day on average.
Alaska has also had the most vaccine distributed to the state, at about 14,800 doses to be administered per 100k population. California, Kansas, Mississippi, Pennsylvania, New Hampshire, Massachusetts, and Rhode Island follow with around 7,000 doses per 100k population. President Biden has increased the target to 1.5 million administered doses per day, with the goal of getting “100 million COVID-19 shots in the arms of the American people” by the end of April, which marks his 100th day in office.
While vaccines continue to be administered and new case rates have dipped, emerging COVID variants have raised concerns that these mutations could cause another surge in case numbers.
Please continue to wear a mask (better yet, double up!), practice social distancing, wash your hands and stay at home as much as possible to decrease the spread of the virus.
Edits by Susan Paykin.