Some Counties with High Vaccination Rates Still See High Case Rates
Weekly update from the US COVID Atlas team
By Kenna Camper
Over 183 million COVID vaccines have been administered across the U.S. and over 70 million are fully vaccinated, including those who have received the single dose Johnson and Johnson vaccine, according to the CDC. Still, the 7-day average new case numbers have increased over this past week, reaching about 65,000 to 75,000 cases per day, alarming health officials and hospitals nationwide.
This has left many, including us, wondering: If more vaccinations are being distributed, why has there been an uptick in cases?
We can now explore rates of full vaccination at the county level on the US Covid Atlas, as the CDC recently made this data available for most US counties. This allows us to dig deeper into the vaccination data, previously only made available aggregated at the state level, and identify localities where vaccinations might be affecting or affected by their COVID case rates.

Vaccination trends
Vaccine administration has continued to ramp up significantly in recent weeks, with 21% of the U.S. population now fully vaccinated and 35% having received at least one dose. However, these vaccination rates differ between states. New Hampshire, New Mexico, South Dakota, Maine, and Vermont have some of the highest rates of vaccinations, as at least 40% of these states’ populations have received the first dose and over 20% are fully vaccinated.
States with the lowest percentages of vaccinations include Mississippi, Georgia, and Alabama: under 30% have received the first dose, and less than 20% are fully vaccinated. These states currently have the largest amount of doses to be administered per 100 people, so rates of vaccinations in these states will likely increase quickly over the next few weeks.
COVID Case Trends
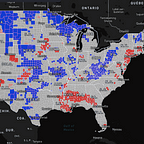
While daily cases have decreased significantly since January, COVID continues to spread and there has been a spike in cases since late March. Last week, between April 2nd through 9th, large multi-county clusters have developed across the entire state of Michigan and large swaths of Minnesota. On the East Coast, a hotspot cluster has formed around the borders of New Jersey, Pennsylvania, and New York and a second hotspot stretches across the Maine-New Hampshire border.is present between Maine and New Hampshire.
Vaccinations & New Cases
If more vaccinations are being distributed, why has there been an uptick in cases?
Although about 60% of people in the U.S. over age 65 have been vaccinated, the majority of people under the age of 65 have not yet received the vaccine, and there has been concern over several new variants. The CDC has estimated that new coronavirus strains, including the US B.1.1.7 variant, made up about 39% of new cases during a two week period in March. Spring break travel and loosened restrictions have also likely contributed, especially since air travel has increased. According to the CDC,The CDC stated that “the number of 25-to-49-year-olds visiting U.S. emergency departments for diagnosed Covid-19 is now higher than the number of visits among patients 65 and older, “ suggesting that the current case increases across states are largely being driven by younger populations with lower rates of vaccinations. which evidences that recent COVID cases are appearing more in younger populations who currently have low rates of vaccinations.
We’ll be following along in the coming weeks, exploring community characteristics such as age and vaccination rate disparities that may be driving these trends.
With the rise in case rates, please continue to follow CDC guidelines to stop the spread of COVID-19: wear a mask (better yet, double up), practice social distancing, wash your hands, and stay at home as much as possible.
Edits by Susan Paykin.