Uncovering Vulnerable Communities: Hypersegregated Cities
By Laura Chen
Laura Chen is a fourth-year undergraduate student at the University of Chicago and a Research Assistant with the Center for Spatial Data Science.
COVID rates across the country are disproportionately impacting communities of color and areas with high rates of racial segregation. The specific phenomenon of hypersegregation is important to understand in order to fully contextualize its connection to health disparities, as well as race, and income inequality.
“Hypersegregation produces high levels of social isolation from mainstream society, but also high concentrations of poverty and disadvantage,” according to Douglas Massey, the Henry G. Bryant Professor of Sociology and Public Affiars at Princeton University and a leading scholar on hypersegregation. “If you look at the cityscape of the United States, hypersegregated cities are the places where our most severe problems of urban poverty, of racial inequality, of racial violence of various sorts, are taking the most fervent root.”
These cities are often also characterized by large urban black populations, including New York, Chicago, Cleveland, Milwaukee, St. Louis, and Philadelphia.
Segregation has been linked to negative health outcomes, though the overall effects are complex. However, during the COVID pandemic, data has repeatedly shown that the most impacted communities have been those that are poor and communities of color, which are still largely spatially segregated from their wealthier and white counterparts.
The US COVID Atlas features an option to highlight the nation’s hypersegregated cities as an Overlay feature over any map variable. This feature enables targeted exploration and analysis of the impact of COVID on these already-vulnerable communities. We can also call attention to the spatial patterns and inequities emerging in the wake of COVID and the start of the vaccination rollout.
Hypersegregation and COVID-19
Public health researcher Lawrence Brown identified the patterns emerging from COVID’s spread in hypersegregated cities during the first wave (spring) as well as as the second wave (summer and early fall). Brown explains that “hypersegregation results in the hyper-accumulation of resources in White neighborhoods and the hyper-deprivation of resources in Black neighborhoods in core cities and surrounding suburbs.” This extends to the current pandemic, where in hypersegregated cities there are often fewer health care facilities, information and resources, and where people are less able to stay home and stop work to care for sick or susceptible family. Dr. Brown’s analysis of hotspot data from the US COVID Atlas over the summer showed that hypersegregated cities recorded higher clusters of hotspots compared to the rest of the country.
“Hypersegregation results in the hyper-accumulation of resources in White neighborhoods and the hyper-deprivation of resources in Black neighborhoods in core cities and surrounding suburbs.” — Dr. Lawrence Brown
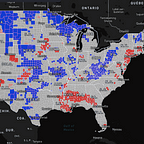
Using the Atlas’ resource overlay function and selecting the Hypersegregated Cities overlay, you can begin to explore these trends. This feature highlights the nation’s most segregated metropolitan area counties and helps visualize the impact of COVID metrics over time. In the map featured below, you see high confirmed case rates persisting in February, with brown representing counties with higher case rates compared to the national average.
Researchers have been working to identify the drivers behind the disproportionate rates in poor and minority populations. Recent research from Qinggong Yu and colleagues at University of Michigan found that COVID’s disproportionate impacts on racial minority groups are “consistent with the conclusion that structural inequality can produce lethal consequences.” Compared with white communities, segregated Black and Hispanic communities, given the racial disparity in net wealth, are more likely deprived of a wide range of social, medical, and other related resources. In the context of this pandemic, such other resources include access to healthcare, hospital and clinic facilities, and general information about public health, thereby making them more vulnerable to infectious diseases and compounding the challenges posed by a lack of resources to start.
To explore this, these researchers looked at the growth rate of confirmed COVID‐19 cases and deaths in an early 30‐day period of the outbreak in the counties located in each of the 100 largest metropolitan areas in the United States. They found that the growth of cases and deaths in metropolitan area counties with high segregation was greater for Black and Hispanic populations than for white populations. Moreover, the effect of racial residential segregation was made stronger by increased income inequality within each county. They conclude that “these data strongly suggest that racial and economic disparities have caused a greater death toll during the current pandemic.”
Impact on Vaccinations
Initial data suggests that hypersegregation is also affecting which groups have access to and are getting the COVID-19 vaccines.
The Kaiser Family Foundation recently identified early “warning flags” that racial inequities were persisting in state vaccination campaigns. According to data through January 19, shares of vaccinations among Black and Hispanic people were lower compared to their shares of the total population in most reporting states, while the share of vaccinations among white people was disproportionately higher.
Similarly, a recent analysis by The Chicago Tribune revealed high disparities in vaccination shares between Hispanic, Black, and White groups throughout the City of Chicago. Chicago is considered a “Category 5” hypersegregated city, characterized by some of the highest rates of residential segregation in the country. The highest rates of COVID cases and deaths have consistently been in majority Black and brown South and West side neighborhoods, and these troubling trends appear to be continuing into the vaccination campaign. Chicago’s population is roughly evenly split between its white, Black, and Hispanic communities — each roughly composing 30% of the city populations. However, as of February 12, 11% of white residents had received at least one dose of the two-dose regimen of vaccine shots, while the same was true of just 5% of Black residents and 4% of Hispanic residents. See the chart below from the Tribune for the full breakdown.
While local, state, and federal officials work to implement the vaccination campaign as well as mitigate the ongoing crisis, it is critical to approach responses with equity as a guiding principle. Segregation not only affects where people can or cannot live, but now there is evidence that shows it affects outcomes during an infectious disease pandemic.
More research is still needed to better understand these complex impacts of segregation, structural racism, and other social determinants of health during this pandemic.
Please continue to follow CDC guidelines to stop the spread of COVID-19: wear a mask (better yet, double up), practice social distancing, wash your hands, and stay at home as much as possible.
Edits by Susan Paykin.