US Reaches Over 25 Million COVID Cases
Weekly updates on the geography of COVID
By Kenna Camper
COVID continues to spread across the U.S., which has now seen more than 25 million coronavirus cases and 414,000 deaths due to the virus. President Biden has signed executive orders for economic relief related to the pandemic as well as for expanding testing and treatment. Yet as case numbers continue to rise, wearing masks, washing hands, and social distancing remain essential to combating the virus.
This week we’ve integrated data from our newly-launched Weekly Hotspot Report to compare trends we saw in Atlas visualizations in order to provide a more detailed county-level update. This interactive, weekly data report presents high-level Atlas data summaries with a focus on county-level, statistically-significant hotspot trends. We’ve chosen to present it in an accessible, easy-to-digest format through Observable, a code integration and data exploration platform. The Report is an additional resource for Atlas users to quickly identify both emerging and stable hotspot counties, and summarize their data to better understand local and regional trends.
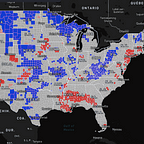
California has remained a location of both stable and emerging hotspots, as 17% of its counties are in a hotspot based on population-adjusted case rates. Southern California’s San Bernardino, Los Angeles, and Kern counties lead the state in confirmed cases, with other regional counties not far behind — with hotspots geographically spanning up through Fresno and Monterey counties. See map below for county breakdown.
Nearby, more than 46% of Arizona’s counties are statistically significant hotspots, , with cases concentrated in counties around its border with Southern California. Yuma, La Paz, and Maricopa county have the highest population-adjusted case rates in the state. Though it is one of the less populous and more rural counties in the state, La Paz county, where more than 39% of the population is aged 65 years or older, may be particularly vulnerable due to its relatively large senior population. Recent estimates suggest that about 1 in every 11 county residents has or has had the virus.
Looking to the Midwest, Kansas is another state that remains a stable hotspot, with new cases emerging quickly. Nearly the entire eastern half of the state falls into the hotspot category by population-adjusted cases, with particularly high cases in southern Sedgwick county. This high case rate appears to be spilling over into northern Oklahoma counties, as well.
On the East Coast, based on total raw case counts, New Jersey, Connecticut, and Massachusetts show rapidly emerging hotspots, with 50% or more counties in a hotspot in each state.
Virginia, North Carolina, and South Carolina have also seen increases in cases, especially with multi-county cluster hotspots appearing around the majority of South Carolina. Large clusters are also appearing in the southern part of Virginia, including Charlotte and Lunenburg counties.
Finally, in the south, counties in eastern Texas and south and central Florida are reporting especially high positivity percentages. Areas centered around Texas’s Dallas and Harris counties and Florida’s Miami-Dade county are stable hotspots based on population-adjusted case numbers.
Although vaccinations and testing plans are expanding, virus hotspots are continuing to emerge. In order to slow its spread, we should continue to wear masks, social distance, and avoid travel by staying home when possible.