What the Last Week of 2020 Revealed About the State of the Pandemic
Weekly highlights of the geography of COVID
By Laura Chen
The last week of 2020, from December 25, 2020 to January 1, 2021, saw a sustained rate of increasing COVID-19 cases across the country. Throughout the past few months, there has been an alarming rate of COVID-19 numbers in midwestern counties compared to counties in east and west coast states. However, the last week of 2020 strongly revealed that spillover in COVID-19 cases has occurred across the country, possibly a result of latest holiday travel and gatherings nationwide. The first few days of 2021 are also showing spikes of COVID-19 numbers around the country.
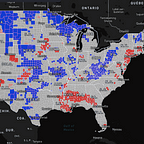
We saw counties in states like California, Texas, and New York remain consistent hotspots from December 25 to January 1. Between December 28 to December 31, California’s southern counties like San Bernardino, Los Angeles, Riverside, San Diego, Orange, and Imperial remain COVID hotspots. This means that the rate of COVID cases in these counties was rising at a rate higher than the rest of the surrounding counties and likely introducing spillover into other counties in California.
Likewise, northern counties in Texas are of concern, especially Archer, Wichita, Clay, Montague, and Jack. On Christmas Day, the state saw a high rate of increased cases compared to the rest of the country (see below). The state is reportedly facing a record-high number of COVID-19 hospitalizations as of Sunday, January 3, 2021.
Between January 1 and January 3, cases in New York saw a spike of COVID-19 cases compared to the rest of the country, especially in Suffolk county.
Despite the rollout of two CDC-authorized vaccines, it is still important to understand that the virus is spreading across the country at a very concerning pace. In order to safely proceed in 2021, we must act with as much caution and care as possible. In this new year, we should continue the following practices: maintain social distancing, wear a mask, wash your hands regularly, and stay home when possible.
Editor’s Note: Because there is no one single validated source for county-level COVID cases and deaths for real-time analysis, we incorporate multiple datasets from multiple projects to allow for comparisons. The data source referenced in this post was USAFacts. We have since observed variation in USAFact’s late December data, likely due to the holidays. The data for this time period may now appear differently than when this post was written, but the overall hotspot trends and rising rates in these regions remain the same.
We want to hear from you
We are excited to be working on new features and upgrades to the Atlas, to be released in early 2021. The updates are well underway, but we need your help to make sure that the changes we’ve made work with how you use or might use the new Atlas. Give it a spin here and let us know your thoughts on the feedback form. Thanks for your input!
Follow & stay informed
Make sure to subscribe to our monthly newsletter and follow us on Instagram and Twitter for updates and news about the Atlas.
Laura Chen is a Research Assistant with the Center for Spatial Data Science at the University of Chicago.
Edits by Susan Paykin.