Year in Review
Reflections from the Atlas team, and what’s on deck for 2022

When we built the US Covid Atlas in March 2020, never could we imagine we would still be here in December 2021.
Now approaching 2022, we are reflecting on how we are still very much still in this pandemic. New variants, hospitals and healthcare workers at capacity, increasing local & global health inequities, and an overwhelming trove of data to sift through and try to make sense of it all.
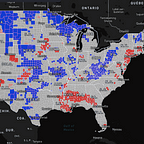
Particularly in this pandemic, data are much more than a number. Data are individual lives, collective experiences, events, geographies, stories. Our work this year with the Atlas has focused on developing tools and strategies for communicating these different stories and insights, centering health and racial equity across our initiatives, across the places and people disproportionately impacted.
The US Covid Atlas is led by a group of committed researchers with diverse backgrounds in data science, web design, public health, and nonprofit and community engagement. Through all the challenges of this year, we were proud of our work and accomplishments, ranging from major technical & back-end infrastructure upgrades to convening a brand new Community Advisory Board to guide and inform our work. And there’s much more to come with the US Covid Atlas — in 2022 we’ll be rolling out a community toolkit with a suite of fresh tutorials, new custom data loading and visualization features, and an oral histories layer that will integrate peoples’ stories & lived experiences with our maps and tools.
Read on below for a selection of the team’s highlights from this year.
Aresha Martinez-Cardoso, Assistant Professor of Public Health Sciences:
In January 2021 our fearless leader, Marynia, reached out to me to ask for a meeting and we spent some time nerding out about our research at UChicago, social determinants of health, and the Atlas. Fast-forward nearly a year and it’s been a whirlwind joining the COVID Atlas team, learning about the pandemic, and lending my insights to all our great work. As a newbie to the team it’s been fun digging into all the data layers built into the Atlas, and I’m especially excited to work with Dylan and the rest of the team on building the interactive results-report feature in the coming year. It’s also become abundantly clear this year that the COVID is sticking around and we’re only starting to understand the long-arm of the pandemic on racial and social inequalities. That’s why I was also eager to help organize the Community Advisory Board who will advise our team on building out tools and features in the Atlas that can be harnessed to better understand the communities that have been hardest hit by the pandemic.
Qinyun Lin, Postdoctoral Scholar:
It is hard to believe that COVID has been with us for almost two years. Since we launched the Atlas in March last year, more and more data from different perspectives have been integrated and it is even clearer now that places and contexts matter in different ways for different people. Now that more pandemic-related data than ever is available to us, it is time for us to reflect on what we can learn from changing policies, understand where we are in the pandemic by tracking vaccine data, and more importantly, investigate the structural inequality that (re)produce disparities. As researchers, we have been taking an exploratory approach in our past and ongoing work so that we can notice trends that we didn’t expect to see. Meanwhile, we are also working hard to leverage different quasi-experimental designs to disentangle the causal mechanisms underlying the (re)production of disparities. Though we primarily work with quantitative data, we always acknowledge the other side of the story: lived experiences of COVID are far more complicated than data points. Indeed, I very much look forward to our oral histories project next year as I see it as an essential step towards humanizing data science by integrating individual-level lived experience with spaces and contexts in various communities. Looking forward, we also continue to seek your feedback and look forward to incorporating your perspective into the Atlas as well. Stay healthy. Stay safe. Stay tuned for more updates on the Atlas!
Dylan Halpern, Senior Software Engineer:
Around this time last year, we began planning the next phase of the Atlas and the extension of our work with the Robert Wood Johnson Foundation. We had hoped, by this time this year, the vaccine coverage would mean a slow, slightly shaky emergence from pandemic life back to some form of normalcy. We have planned new avenues to tell the stories of COVID’s unequal impact, archive and catalog the many data generated along the way, and engage with new communities. But we remain in the trenches, keeping up day to day and week to week with new issues, shifting and uncertain data, and the perennial challenges that the pandemic brings. Our work continues in managing, delivering, and communicating data and insights on the pandemic much in the same way it did for the first year of the project, iterating towards a better Atlas platform for data communication, visualization, and storytelling. We enabled custom data loading in the Atlas which means that you can BYO-data for more detailed COVID stats such as state or regional ZIP codes or city neighborhoods. We continue to bring in new vaccination and policy data to understand the resiliency of our American communities. For now, as was the case much of this year, a few remain salient: stay safe, stay sane, get vaccinated, and get boosted.
Susan Paykin, Research Manager:
I’m excited by the possibilities of making all the work that’s come out of the US Covid Atlas accessible and relevant to new audiences. There are many COVID data tools that have come online in the last two years, but what I think makes our special is that it is built and maintained by a (relatively) small-and-scrappy team, which means we can be uber responsive to requests from users — for example, adding additional data, checking the accuracy of a locality’s statistics reporting, improvements of a visualization feature, clarifying information or insights coming through on the map. It’s interesting to learn from others who are using the Atlas or looking at data in new ways. It takes all kinds of perspectives, particularly in local communities, to understand the impact of the pandemic and how we should effectively respond to keep people safe. This type of open source data infrastructure is especially critical because state and local public health infrastructure in the US, particularly in but not limited to rural areas, has been chronically and systemically underfunded since the 1970s. We’ve seen not only how that impacts public health resources on a tangible level (testing sites, hospital ventilators, nurses and health care professionals) but also in the effective spread of information (or misinformation) and timely public communication. I hope those policies change. But in the meantime, we’ll continue to help. I hope you’ll join our virtual Community Focus Group in January to share yours.