
Fakes, flames and memes [part 1]
Explorations on Twitter visual imagery during the 2015 no-expo demonstration in Milan
Read the second part of the story here
This work was presented at the Picturing the social 2016 conference, organised by the Visual Social Media Lab.
Matteo Azzi. After receiving his Master degree in Communication Design, Matteo worked at DensityDesign Lab as research assistant. Now he is a researcher and designer at Calibro, where he works on data-driven design projects and carries out researches in the field of data visualisation and information design.
Gabriele Colombo is a designer and PhD candidate at DensityDesign, a research lab of the Design Department of Politecnico di Milano. His research project focuses on the definition of design strategies to deal with pictorial content in the context of issue mapping online. He holds a Master Degree in Communication Design from Politecnico di Milano.
On 2015, the traditional MayDay Parade demonstration held on the 1st of May in Milan coincided with the opening of the Universal Exposition. Milan Expo 2015, a huge international fair around the the topic of “feeding the planet, energy for life” was controversial since its conception in 2008. On May 1st 2015, the traditional march dedicated to precarious workers, migrants rights and anti austerity measures, became the occasion to protest against urban speculation, corruption and lack of transparency in the development of the event. When a group of activists, part of the large anti-expo march, started rioting, the visual coverage of the day seemed to quickly lean towards a well-known form of riot pornography, with images of cars on fire and smashed shop windows. Starting from a dataset of 500.000 tweets, we use approximately 200.000 tweets containing images to observe how the events (both the official opening and the march) were visually framed throughout the day.
Framing the day
In 2008 the International Exhibitions Bureau decided in favour of the candidature of the city of Milan to host the International Expo on 2015. Throughout the years before the inauguration, a series of scandals regarding the site construction mined the credibility of the event. At the same time, doubts were raised regarding the need of such an expensive project, partially financed with public money. During the 3 months before the inauguration, criticism raised even more, when it wasn’t sure whether the event site was ready to open on the set date of May 1st.
On May 1st, International Workers Day, in Milan like in other cities around the world, different demonstrations take place. From 2001 the most important one is a self-organised march, called MayDay Parade, counting even more than 100.000 people in the past years. Milan MayDay Parade, traditionally dedicated to precarious work, migrants rights and anti austerity measures, became in 2015 the collector of all the movements protesting against the Universal Exposition in the past 5 years
On the same day, two important events, geographically distant (the march happening in the city center, while the Expo site in a northern suburb just outside the city) but chronologically symmetrical and part of the same complex discourse. On one side, the celebration of national pride, with the rhetoric of Milan as international and attractive city, new infrastructures and job opportunities connected to the event; on the other side, activists raising criticism against corruption scandals and poor working conditions of those involved in the event.


Given this particular layout, we set out to observe how these two very different narratives unfolded on Twitter during the day, looking in particular at the what type of visual material was shared:
- How are the two narratives visually characterised? What kind of imagery composed the two spaces throughout the day?
- Which top events can be spotted, by looking at the visual material shared on Twitter?
- Did the protest issues manage to visually hijack the Twitter official space of the event inauguration?
Data collection
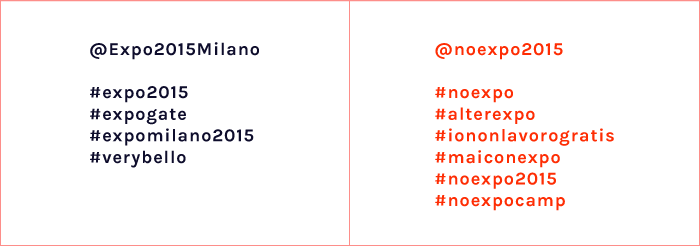
We selected a group of hashtags, both related to the official event and the protest event, and added to the bin also all tweets mentioning the official exposition account and the official no-expo account.
We collected in real-time all tweets IDs starting from the day before the event. For this task we used the Digital Methods Initiative Twitter Capture and Analysis Toolset, a toolset for capturing and analysing Twitter data. When almost one year later we tried to retrieve them all, out of almost 500.000 tweets we found a lot of them being not available anymore (for a number of reasons such as deleted tweets or deleted accounts). Of the available ones, we considered for our analysis only those containing an image and shared on the 1st of May.
The approach we used to deal with this large collection of images was a mix of distant and close reading. We defined 4 different protocols, each applying a different level of zoom, therefore enabling different kind of observations.

1 — Top issues (co-hashtags analysis)
The first analysis focused on the hashtags used in the tweets containing images. We wanted to see if there was a polarisation in the language used during the day, and understand which topics were connected to one side or the other. We grouped the 2 seed lists of hashtags into 2 poles (the official [Expo] and the unofficial [No Expo]) and then observed how the other top hashtags moved in the space. On the right side there are those used almost exclusively with the official hashtags, while in the center are positioned the shared ones. On the left side there are no elements because the no-expo tags were mainly used together with the official ones. We then manually identified clusters of similar content, starting from the bigger nodes (hashtags with more frequency).
- The first group is the one very close to the official hashtags. These are among the most retweeted topics, and they are all related to the main theme of the event [food, foodie, foodporn, ricette, gialloblogs].
- Closer to the center, there are tags related the opening itself, with the celebration of national and Milanese pride [orgoglioitaliano, stupiamoilmondo, orgoglio italia, expottimisti, theopening, milanoaplacetobe].
- On the top left we see the issues raised by the protesters. [migrazione, mose, grandiopere, tav, mafiacapitale]. They are very low in frequency and placed in the left part of the visualization, suggesting that the occupation of the official discourse by the protest issues was not really successful.
- The protest is more central in the map (shared with both official and unofficial hashtags), and especially everything concerning the riots: a large group of hashtags [nessunotocchimilano, milanobrucia, iostoconlapolizia, blackbloc, vandali] mainly used for condemning the violent protest.
Just looking at the language used, the main issues of the two poles -expo and no-expo- seem to disappear in favour of the riots.

2 — Temporalities and main events of the day
We then started to look at the images shared during the day by both sides. As a first approach, we adopted a zoomed out view on the full dataset, in order to see if we could spot particular patterns in the development of the day, just by looking at repetition of similar images. Images are laid down chronologically from top to bottom. The two groups represent the images shared exclusively with the Expo set of hashtags (on the left) and those shared exclusively with the no-expo group of hashtags (on the right).
The first observation enabled by this visualization is about the amount of images in the two stories, providing an insight on how the two narratives unfolded differently in time. The official story is regular, each hour having roughly the same amount of images shared, while the no-expo timeline is distorted in the afternoon, with a greater amount of images shared after the riots.

Then, we started looking at waves of similar images in each of the two timelines, focusing on those areas of the composite with repetition of the same colors. In the official set, we identified 4 major waves of similar images. The first one is composed of images of the ceremony in which the tree of life, symbol of the exposition, was turned on for the first time the night before the opening. Then, around 8:00 AM there is a second wave of light blue images, composed by the official Expo communication material being retweeted multiple times, in the morning. Then, around 12:00 AM, images of the national air force show, part of the opening ceremony, are retweeted multiple times. In the night, riots occupy the visual space with images of burning cars being shared after 20:00 PM (after the time in which the riots took place).

Looking at the no-expo timeline, we find a very different story, mainly focused on images of riots, even though shared with a different timing compared to the official story: images related to the riots quickly appear at 5:00 PM, right after the actual events happened. In the night, images of burning cars and iconic images of protesters wearing tear gas masks are quickly replaced by a variety of images-texts sharing opinions on the day. At the very beginning of the timeline (before 2:00 PM) several images of the material prepared by the protesters are shared, but quickly disappear after two hours.

Read the second part of this story here

