Mapping buildings with help from machine learning
Over half the world’s population lives in urban areas, many in unplanned urban sprawl. The high rate of urbanization is a major challenge for keeping cities safe, resilient, and sustainable — the aim of the UN’s Sustainable Development Goal #11. One component of achieving this goal is tied to accurate maps of buildings. With complete maps, urban planners can more effectively improve infrastructure including public transit, roads, and waste management. Toward this goal, we’re working on machine learning (ML) tools to recognize buildings and speed up the urban mapping process.
Autonomously mapping buildings remains an area of active research as human-level precision is very difficult to attain. However, this doesn’t mean that existing algorithms aren’t beneficial. Simply suggesting where to map — instead of actually doing the mapping — can still improve mapping efficiency by helping human mappers spend their effort more efficiently. Based on model performance, we can roughly break the algorithm’s usefulness into three tiers:
- Low precision. A low precision ML model can analyze large areas of ground (e.g., a city block) and provide a square meter estimate of total building footprint. If there is a large discrepancy between this prediction and known map, we can prioritize these areas for human review.
- Medium precision. Here, an ML model can approximately outline individual buildings though building edges might be off by several meters, or it cannot separate buildings with complex geometries (e.g., tightly spaced apartment buildings or informal settlements). The algorithm can suggest individual locations for human review.
- High precision: A high precision algorithm can identify building outlines within a meter or two of the true geometries in a diverse set of urban and rural environments. These pixel segmentation maps can be vectorized (i.e., traced) autonomously, validated by a human, and then imported into an existing map (e.g., OpenStreetMap). This is the ultimate goal for automated mapping algorithms.
Our current building prediction tool is somewhere in the low to medium precision range. We’re testing an approach that uses Google’s DeepLabV3+ segmentation algorithm. Like other segmentation models, it’s designed to make a prediction on whether each pixel is part of a building. We chose DeepLabV3+ because it is relatively powerful (making use of developments like depthwise separable convolution, atrous spatial pooling, and an Xception backbone) and has been a top performer on competition datasets including PASCALVOC and Cityscapes. A number of other groups have generated positive building mapping results including SpaceNet Challenge participants, Azavea, Mapbox, Microsoft, and Ecopia.
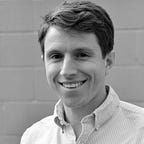
We trained the model using RGB images from the SpaceNet Challenge dataset, which draws from a broad set of regions. Specifically, we combined data from Las Vegas, Paris, Shanghai, and Khartoum. Our aim here was to train a single broadly-applicable model trained that will perform well in many areas of the world. We also used tweaked the model’s prediction task — instead of predicting if each pixel belonged to a building or not, we applied the signed distance transform using scikit-fmm (as shown in the following figure).
Process of training a building segmentation algorithm. Using RGB satellite images (left) and true building locations (middle), we train an algorithm to recognize which pixels belong to a building. The animation shows progressive improvement from early to late training. Pixels are colored based on the signed distance transform, which encodes their distance from a building border. Red pixels are inside a building boundary while blue are outside and color intensity indicates absolute distance from the border.
We’ve deployed this in our UrChn tool to track Urban Change. UrChn allows users to superimpose a grid over urban zones where hot colored squares indicate areas that the model predicts a larger building footprint (in sq. meters) than exists in the OpenStreetMap baselayer. As mentioned earlier, the goal is to direct mappers to regions where their efforts would be most beneficial rather than directly predict building footprints.
Building detection model can guide mappers to areas needing the most attention. In UrChn, the total estimate building footprint is calculated in two different ways: (1) using OpenStreetMap and (2) using our ML-based building detection model. We then compute a “difference map” between two building footprints to help visualize the areas that are under-mapped. In this example, we only ran the building detector within the boundaries Madrid proper (hence, zero predicted buildings in the suburbs near the animation’s edges).
There are a number of future improvements we hope to add:
- We need to expand our training dataset (using our Label Maker tool) to include more images from the global south. Almost all of the building segmentation data comes from the Western world; we can’t expect algorithms to be accurate in developing regions until we expand our training data to those areas.
- We are exploring the best ways to provide predicted building maps to human mappers. We hope to integrate our work beyond UrChn into other tools (e.g., the Humanitarian OpenStreetMap Team’s Tasking Manager or the JOSM and iD editors for OpenStreetMap). This integration should be sensitive to a mapper’s preferred tasks and skill level.
- We want to expand the model to also identify roads. Buildings and roads are typically the two features we are most interested in mapping and DeepLabV3+ has the capability to handle both at once.
This project is not open-source yet, but we plan to release it as the work moves from a research project to a more stable tool.