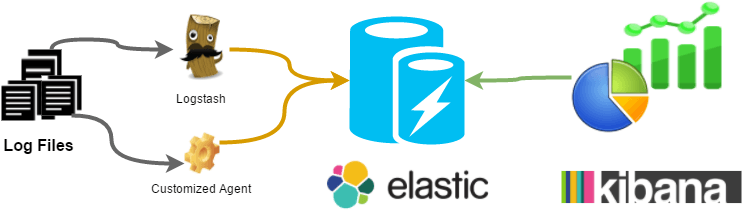
8小時學會 Elasticsearch、logstash和Kibana 三個大數據分析三個工具,經由專業的講解和並且實地的演練,讓你進入資料分析的世界。
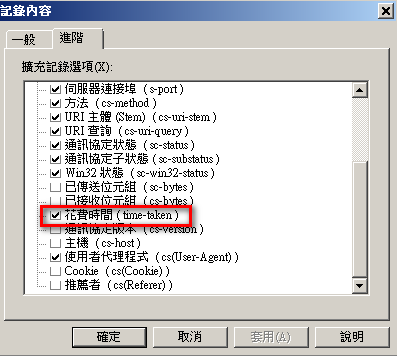
在log 中, 經常出現2個時間,例如為開始時間和結束時間, 在導入elasticsearch 中,在logstash 中, 需要增加一個將時間差的欄位,無需另外的撰寫其他的落地程式。
"@timestamp": "2015-10-20T13:52:47.000Z" # this is when the host says the event occurred"received_at": "2015-10-20T02:02:51.191Z" # this is when Logstash…
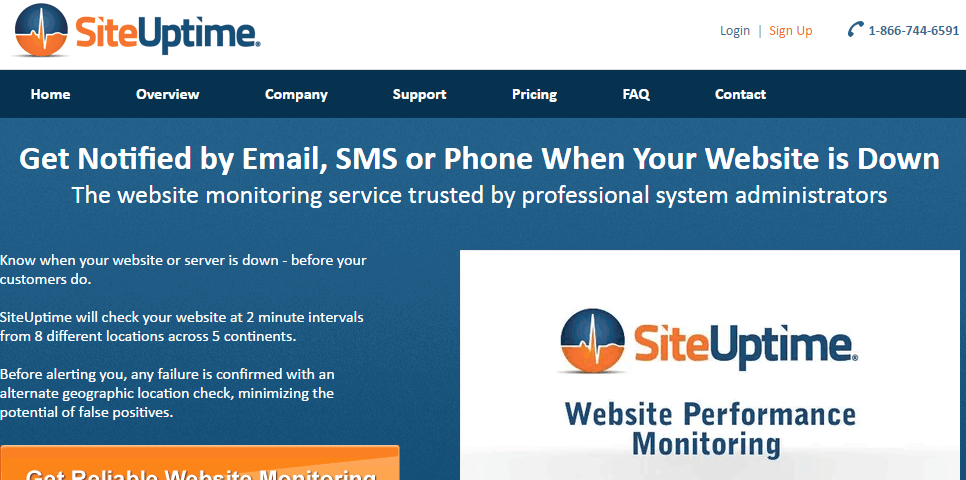
SiteUptime 提供遠端的網站監控功能,以數個網路節點定時檢查網站是否出錯,當網站一發生狀況無法連線時,SiteUptime 就會即時以 E-Mail 通知您,減短您網站無法連線的時間。
日誌解析器是一個功能強大的多功能工具,可以對Windows®操作系統上的基於文本的數據(如日誌文件,XML文件和CSV文件)以及關鍵數據源(如事件日誌,註冊表, 文件系統和ActiveDirectory®。 您告訴Log Parser您需要什麼信息以及您希望處理哪些信息。 您的查詢的結果可以在基於文本的輸出中進行自定義格式,或者可以將其持久化到更多的特殊目標,如SQL,SYSLOG或圖表。
elasticsearch 是採用 Apache上Lucene的查詢語法,包含欄位查詢、模糊查詢、鄰近查詢、範圍查詢、語詞權值群組查詢
字詞定義
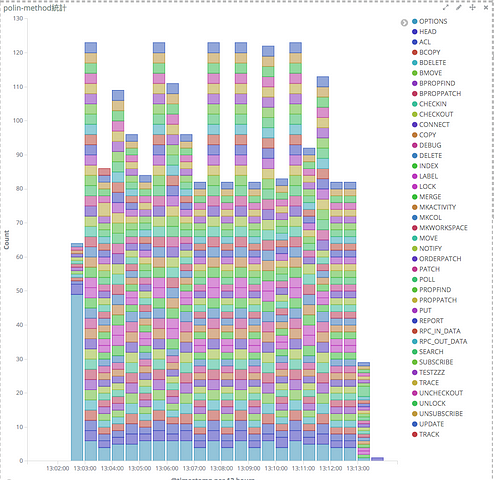
在IIS 的method 經常看見的是GET 和POST 的方式訪問網頁, 頂多有HEAD 等,多種method, 這下子該有的防護,就應該完整了
圖一:在10分鐘內,發現有8000 多筆異常的訪問
Event Log Explorer 事件日誌資源管理器™ 提供良好的事件代碼的答案,以便查詢、觀察和分析在安全,系統,應用程序和Microsoft Windows Server操作系統的其他日誌中記錄的事件說明。
同時和與知名事件知識庫(EventID.net和Microsoft知識庫)的兼容性