Web performance is a distribution
How Fast Should Your Site Load?
The answer shouldn’t be a fixed number.
Go ask Google. You’ll find a bunch of articles telling you that 2–5 seconds does the trick. But what makes 2–5 seconds the prescribed range? Your gut tells you that the answer has to be more complicated than that.
Congratulations. You’re right. The answer is much more nuanced than any time range can answer. The problem lies in the question itself.
Not all sites and visitors are the same
This question has a flaw. It assumes there’s a standard for different circumstances. Websites are different. Users visit sites under different conditions.
A static blog is different than a graphics editor and 4G is a heck of a lot faster than 2G. A static blog may need no JavaScript whatsoever whereas a graphics editor uses quite a lot of it. A 4G visitor may deal with only 50ms of latency and a 2G user could suffer through an entire second per round trip.
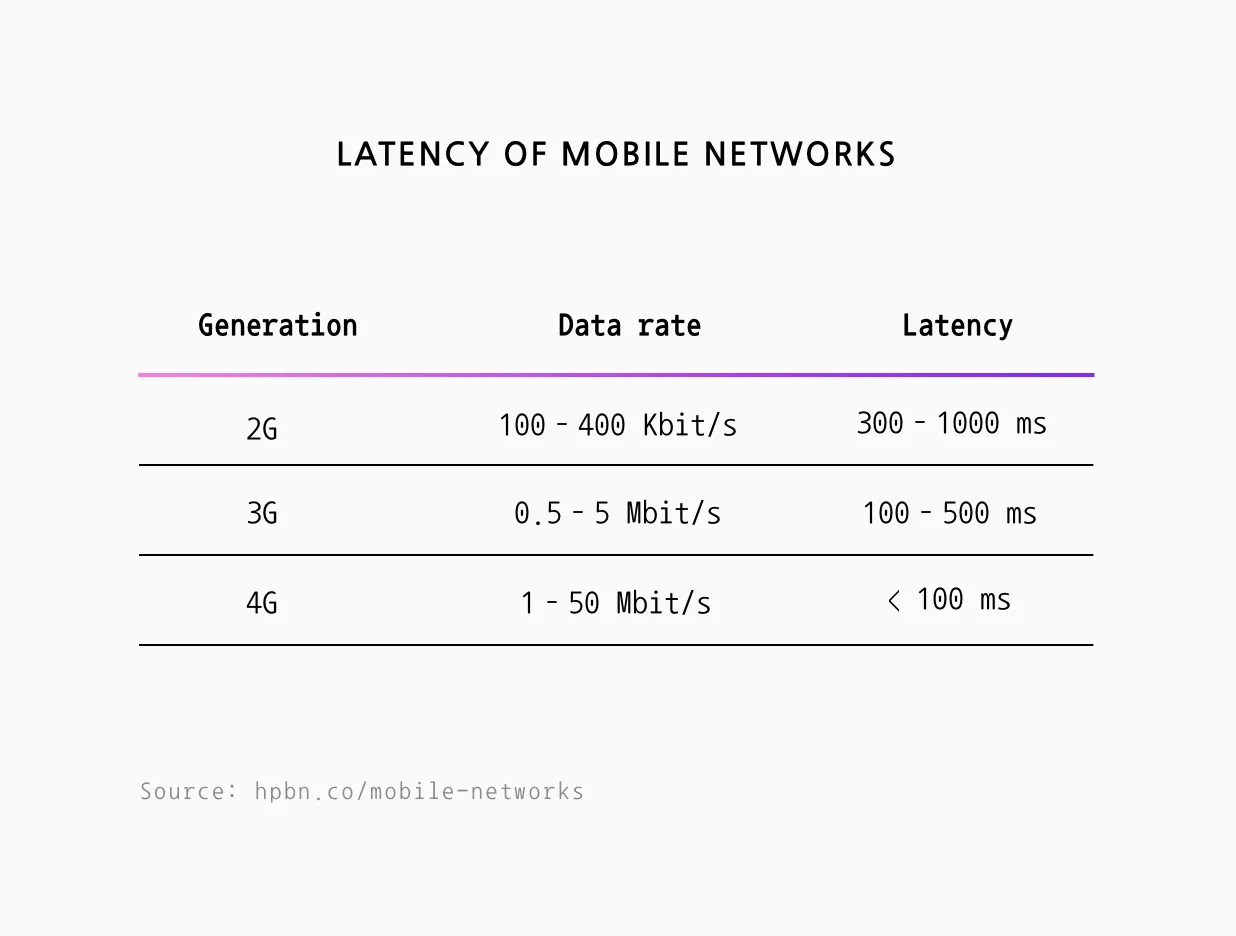
The table above describes data rates that are achieved in ideal conditions. Sitting in an underground parking garage is not ideal but it happens to all of us. This means the network conditions that users come to your site on are variable.
Variability of network conditions
Network conditions when tweaked result in dramatically different page load times. Let’s say we have two users who are going to visit my personal website (davidea.st) on a mobile network. It’s just a static site with no render blocking JavaScript. The index.html document is only 2.3kb and the CSS is 1.8kb. The first user visits with 400kib of bandwidth (2G speeds) but 100ms of latency (4G speeds). The second visitor also has 400kib of bandwidth, but 1000ms of latency (both 2G speeds).

It’s the same exact site, but tweaking the latency only (which is easy when you’re in a parking garage) increases the load of the index.html by ten times. So if latency alone can drastically change the page load of the same site, does it make sense to ask “How fast should my site load?”
You the developer can’t control what network a user comes on. Which means that web performance isn’t about knowing a solid number that your site loads in. It’s knowing that your page load is a spectrum of different times under different conditions. The only way to know this is to measure.
RUM: Measuring real world performance
That’s exactly what you get with RUM monitoring. RUM or Real User Metrics, collects important performance metrics from page loads and beacons them to a server where you the user gets to see the data in a dashboard.
RUM providers come in different shapes and sizes, but for the sake of this article I’m going to use Firebase Performance Monitoring. Firebase is like a third child to me and they also pay my salary.
Web performance is a distribution
Imagine if you recorded the first paint times from users who visited your site. Then you took their times and tallied them in a bar chart. It would look something like this.

However, this isn’t a totally accurate visual. Not all users will load the site in the same exact time buckets. The site will load in 1.5 seconds for one person and 1.65 seconds for the next. So instead of a bar chart, we can use an area chart.

This area chart visualizes the distribution of load times. It helps use see the spectrum of load times and what is most common. It represents all the percentiles of load times.

In Firebase Performance Monitoring we provide an entire dashboard of area charts for different metrics.

The x-axis represents a larger array of load times. The y-axis represents the percentiles. What is most interesting about these percentiles is how they are shaped.
The tail
The chart begins to curve sharply up and then slowly curves down forming a tail. This tells us that most users have load times between 1.5 and 3.5 seconds, which can be good. However, don’t let that bump fool you. That tail contains all the problems.

The tail represents your users who encounter the longest load times. The longer the tail, the larger the volatility. This means your site’s performance becomes hard to understand. Some users load quickly, some crawl their way in. So while we need to fight to shorten the tail, we also need to understand what it represents.
When is your site usable?

When most people say “page load” they are referring to when the site is actually usable. This is a bit misleading, because the site doesn’t have to be fully loaded.
Think about a live streaming blog covering a big event. You visit and see over time updates magically appear on the screen. At what point is this page “loaded”? Was it when the first set of updates appeared? Was it when the header loaded?
This isn’t a debate anyone wants to have. Instead we break page load down into more specific metrics.
The metrics of “page load”

Navigation is when the user initiates the loading of the site. This could be from typing the URL and hitting enter or clicking a link. No pixels have been painted. The browser is fetching assets over the network.

First Paint (FP) is one of the most common metrics referenced. It simply asks: when did a non-trivial amount of pixels appear on the screen?
Understanding when pixels start to appear is important because you learn how fast users begin to see something. In some cases this feedback helps a user know that the site is loading and they should hold on.
First Paint can accurately represent “page load” if you are building a traditional server rendered site (different than a server-side rendering JavaScript app). This is because all the HTML and CSS are ready to go without any render blocking JavaScript. The app looks and feels usable. But this can be different for JavaScript dependent sites.
In the case of a lot of Single Page Applications (SPAs), First Paint happens for static elements like headers and footers. The rest of the app is still booting up, waiting for JavaScript to load and execute. The user may see something, but the app is not yet usable.

First Contentful Paint (FCP) cares about when… well… content appears on the page. This is more than pixels rendered to the screen. If your site loads quickly, FCP and FP tend to fire at the same time. But in cases where you block text rendering for web fonts or when content requires JavaScript to load and execute, FCP can stagger behind FP.
FCP and FP can also be the same even when your site loads slow. This is common is large JavaScript applications that don’t render much or any static HTML. In these circumstances, when the JavaScript finally loads, executes, and renders both FP and FCP tend to fire at the same time.

What domInteractve indicates is that the browser has constructed the DOM tree from the static HTML. The browser then starts loading other resources like stylesheets, images, and JavaScript. This is useful to know when the DOM tree has been constructed and when the browser is going to start loading everything else. When do we know that important resources like JavaScript and stylesheets have loaded? That’s what domContentLoadedEventEnd is for. When domContentLoadedEventEnd fires you know that there are no longer any stylesheets blocking any JavaScript execution.
These metrics are useful together because domInteractive tells you when the stylesheet loading starts and domContentLoadedEventEnd tells you when it ends.

Load Event End isn’t always the most useful metric, but sometimes it can tell you quite a bit. The loadEventEnd event will fire when the document’s load has completed. This means the event fires when all resources in the DOM tree have been loaded. All the linked stylesheets, scripts, and images. Resources like images can slow this metric down. If you accidentally upload a 100MB GIF to a site, you’ll see some pretty slow loadEventEnd times. I say this from experience as well.
This metric helps you understand generally how long it takes for your document’s assets to load. Your site can be useable long before this metric fires. Use this as a guide to understanding if you have any heavy assets on the page.

First Input Delay (FID) measures how long it takes for the first user interaction to trigger. You’ve probably been stuck on a page that looks that it’s ready to use, but it’s frozen. The site just doesn’t work no matter how many angry swipes or clicks you throw it. First Input Delay exists to measure this kind of problem.
If you have a static blog, it may not be as useful because FID measures when users can interact with your site. This is usually triggered after event listeners fire. Now for heavy JavaScript apps, this metric could be critical. JavaScript heavy apps have to load, parse, and execute before they can run which can push back the first interactive moments of a site.
Web Vitals
If you are a savvy performance minded developer (or if you follow the great Addy Osmani) you’ve probably heard of the Web Vitals initiative.
Web Vitals is an initiative by Google to provide unified guidance for quality signals that are essential to delivering a great user experience on the web.
The goal is to improve loading performance, interactivity, and stability. The core metrics that make up Web Vitals are:
- Largest Contentful Paint (LCP) (Measures loading performance)
- First Input Delay (Measures interactivity)
- Cumulative Layout Shift (CLS) (Measures stability)
I’m not going to go over each one in detail (because we’ve already covered a lot of metrics) but you can check the descriptions at web.dev/vitals. Each metric is retrieved through a library provided by the Web team at Google.
import { getCLS, getFID, getLCP } from 'web-vitals';getCLS(console.log);
getFID(console.log);
getLCP(console.log);
Firebase Performance Monitoring only supports First Input Delay as a first class metric. Until the others are automatically collected you can use Custom Traces to log Largest Contentful Paint and Cumulative Layout Shift.
Metrics overload
Web performance is full of metrics and not all of them may be useful for your site and situation. I recommend reading through each and seeing how it works for your type of site. Don’t worry about tracking each one. Learn which ones work best for your site.
So, how fast should your site load?
What do we do with these metrics? Now that you know these metrics, we can use them to understand what’s happening on our sites and to ask better questions.
Here’s a specific question to ask: “When does our content first appear for 3G users?” Tracking these metrics in the wild allows you to see what kind of users are being affected and what the trend is over time.
With Firebase Performance Monitoring you can drill into metrics, like First Contentful Paint, to see what dimensions affect the metric. In this case we can split it out by Effective Connection Type (network speed).

The dashboard shows that most users come on at least a 4G or above connection. But 5.88% of users come on 3G speeds and load in 2.24 seconds. And that is a lot better than asking, “How fast should my site load?”
Start measuring
Hopefully you know a bit more about page load than you did before you started this article. If there’s one piece of advice you can take away, it’s start measuring.
Check out the Firebase docs to get started with Firebase Performance Monitoring. It’s just a few lines of code. Measuring allows you to ask better questions and get better answers. And always remember, that page load isn’t a finite number. Web performance itself is a distribution.
