Used Carprice Prediction -Complete Machine Learning Project
A step-by-step guide to your car price prediction machine learning project!
In this article, I am going to walk you through how we can train a model that will help us predict car prices. you’ll practice the machine learning workflow you’ve learned so far to predict a car’s market price using its attributes. The dataset we will be working with contains information on various cars.

Potential Business Problems –
The main aim of this project is to predict the price of used car based on various features.
For car datasets please go to https://www.kaggle.com/nehalbirla/motorcycle-dataset
Github link: https://github.com/TEJASHREE8/car-price-prediction
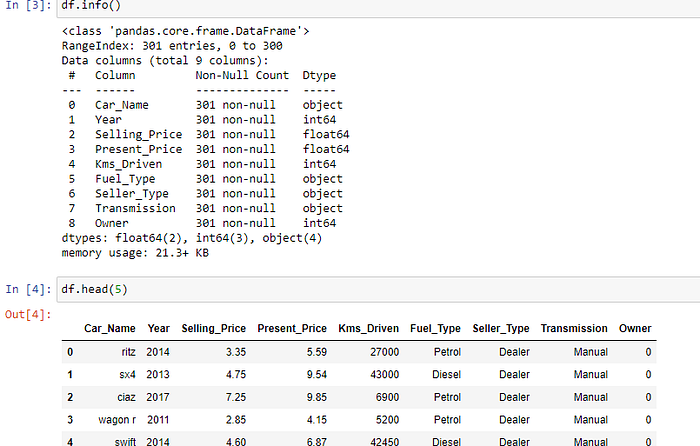
This dataset contains information about used cars. The columns in the given dataset are as follows:
name,year,selling_price,
km_driven,fuel,seller_type
transmission, Owner
The data consists of records of roughly 301 cars and 9 features.
All the Lifecycle In A Data Science Project is divided into four parts:
— — — — — — — — — — — — — — — — — — — — — — — — — — — — — —
Now, let’s start with the task of machine learning to predict car prices using Regression.
Now, let’s start with the task of machine learning to predict car prices using Regression. I will start by importing all the necessary libraries that we need for this task and import the dataset.
1) Importing libraries
2) Importing the dataset

The first thing that we can do when tackling a data science problem is getting an understanding of the dataset that you are working with. Key observations and trends in the data were noted down. All correlations within the variables and the output ‘selling_price’ were monitored.For this you can use df.info,df.head()etc.
In Data Analysis We will try to Find out the below stuff
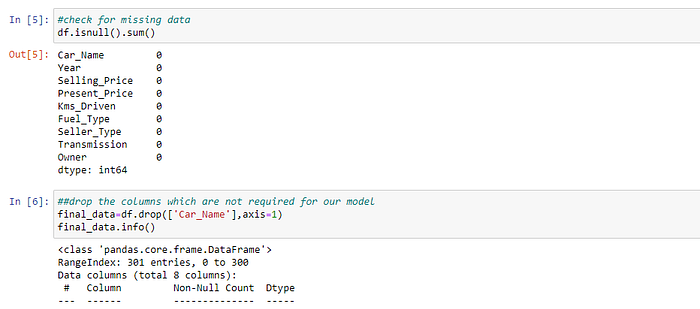
- Missing Values in the dataset.
2. All the Numerical variables and Distribution of the numerical variables.
3. Categorical Variables
4. Outliers
5. Relationship between an independent and dependent feature(selling_price)
— — — — — — — — — — — — — — — — — — — — — — — — — — — — — — —
You can see what the data looks like, but before using it we need to customize it. We will be performing all the below steps in Feature Engineering
- Handling of Missing values
we’ll drop the column if it’s not serving in our model or we can use central tendency measures such as mean, median, or mode of the numeric feature.
Here we drop ‘Car_Name’ column because it is not helpful for our model. There is no missing value in our dataset.
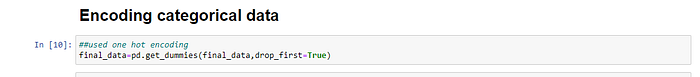
- Substitution of Categorical variables
To be able to use categorical data, we used pd.get_dummies() also called one hot encoding. This essentially turns every unique value of a variable into its own binary variable.
Here, we also add a new feature i.e. ‘no_year’ in the dataset which is derived from the ‘year’ column to analyze data easily.

Visualizing variables and relationships
After cleaning the data, we can visualize data and better understand the relationships between different variables. There are many more visualizations that you can do to learn more about your dataset, like scatterplots, histograms, boxplots, etc Using sns.heatmap(), we can see that the ‘Present_Price’ is positively correlated with ‘Selling_Price’ and ‘Fuel_Type_Petrol’ and ‘Fuel_Type_Diesel’ is negatively correlated with ‘Selling_Price’.

3. Feature Selection
Model Training:
Train-test data splits were conducted. In this situation, we split the data into training and test sets, then fit candidate models on the training set, evaluate and select them on the test set.

- We do not know beforehand which model will perform best on this problem, as it is unknowable. Therefore, we fit and evaluate a suite of different models on the problem. We used Random Forest Regression and Linear Regression Models (Feature Selection) on the train set. we also check which model gives us the best result .you can try any number of regression models and choose one among them which is best suitable.
- we use the random grid to search for the best hyperparameters. A random search of parameters, using 3 fold cross-validation search across 100 different combinations.

- Model selection is the process of choosing one among many candidate models for a predictive modeling problem. after analyzing both models we chose the Random Forest Regression model.
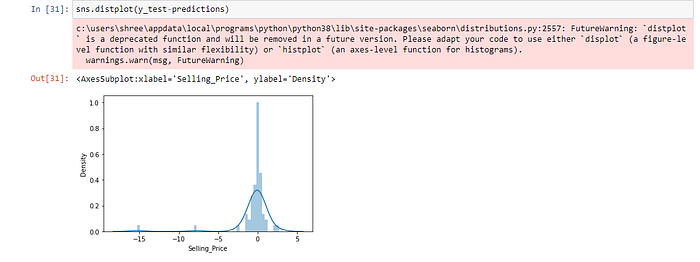
Fitting parametric distributions
You can also usedistplot()to fit a parametric distribution to a dataset and visually evaluate how closely it corresponds to the observed data. it should be a closed Gaussian distributed graph and the difference between ‘y_test’(real value)and ‘predictions’ should also be minimal.
Scatter plots are used to observe relationships between variables and uses dots to represent the relationship between them. here points are nearly aligned in a line.
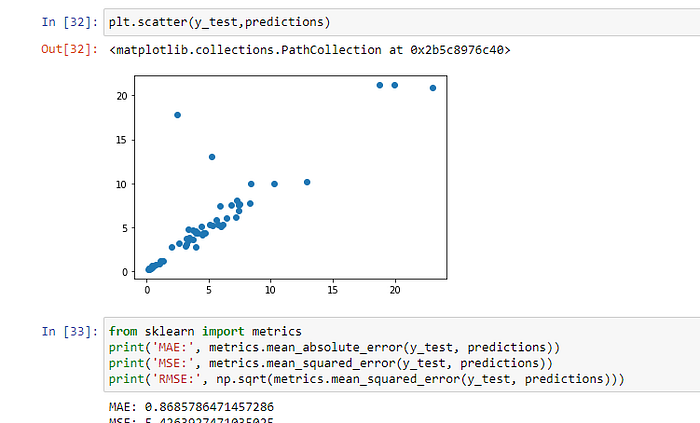
Checking accuracy of the model
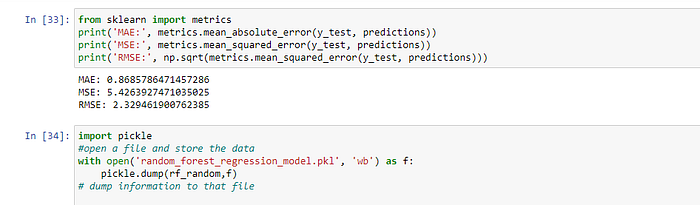
Evaluating the model accuracy is an essential part of the process of creating machine learning models to describe how well the model is performing in its predictions. The MSE, MAE, and RMSE metrics are mainly used to evaluate the prediction error rates and model performance in regression analysis.
- MAE (Mean absolute error) represents the difference between the original and predicted values extracted by averaged the absolute difference over the data set.
- MSE (Mean Squared Error) represents the difference between the original and predicted values extracted by squared the average difference over the data set.
- RMSE (Root Mean Squared Error) is the error rate by the square root of MSE.
Regressor saved as pickle file for faster execution speed in future.
— — — — — — — — — — — — — — — — — — — — — — — — — — — — — — —
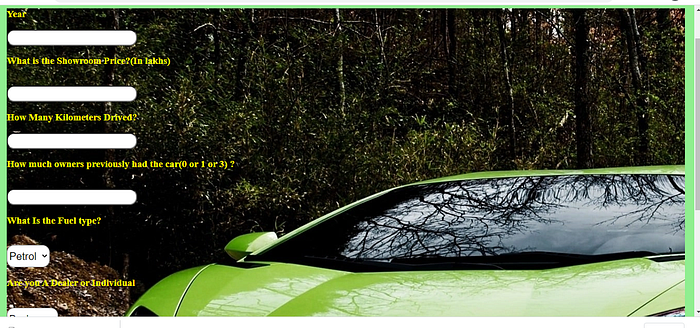
4. Model Deployment
Model Deployment is one of the last stages of any machine learning project. Here, we will design a user interface. we used a flask to make an HTML file for car price prediction. this will take the input value for each feature and calculate the selling price for a used car as shown in the image below.
You can deploy your model on Heroku through the GitHub link.
I hope you liked this article on how to predict used car prices with Machine Learning. Github link is given, where you’ll find all source code. Feel free to ask your valuable questions in the comments section below :)

