What the Heck is Multicollinearity?
The Who, Where, When, What, Why, & How of Multicollinearity.
WHO
Multicollinearity is a phenomenon unique to multiple regression that occurs when two variables that are supposed to be independent in reality have a high amount of correlation.[1] The key to this argument is that they should be independent. Having variables that are not independent creates a bias. Especially if the correlation is extremely high, it can cause an analyst to misinterpret results. That is a very quick overview, so let’s break it down a little more.

WHERE
Where would this occur in the real world? Collecting similar features allows a company to track specific details and the changes in those details over time. In the instance of making predictions, this amount of similarity between features causes problems when trying to build a predictive model. Some common data instances where multicollinearity can occur include:
- Medical Data
- Housing Data
- Employment Information
- Educational Assessments
- Financial Habits
WHEN
When does multicollinearity occur? As discussed a little bit earlier, it occurs when two variables that should be independent are moving along the same linear trend. If you have two variables that are supposed to be used to predict the outcome of another variable, but simultaneously can be used to predict each other, multicollinearity is present. [3]
Below are all of the column names and descriptions from the housing data set from King’s County in Washington State. Looking below there are four features in particular that tell us different things that could be useful but are all highly correlated: square foot living space, square foot lot, square foot above (without basement), square foot basement. We can assume that as the square footage of the basement increases, so does the square footage of the areas above the basement. Likewise we assume that the overall square footage of the house will increase in tandem with the these variables.
Another example from the housing data was bedrooms and bathrooms. We assume that as the number of bedrooms increases, so will the number of bathrooms. It would be strange to have a 6 bedroom house with 1 bathroom. On the other end of the gamut, a 1 bedroom home with 6 bathrooms is even more bizarre.
- id — unique identified for a house
- dateDate — house was sold
- pricePrice — is prediction target
- bedroomsNumber — of Bedrooms/House
- bathroomsNumber — of bathrooms/bedrooms
- sqft_livingsquare — footage of the home
- sqft_lotsquare — footage of the lot
- floorsTotal — floors (levels) in house
- waterfront — House which has a view to a waterfront
- view — Has been viewed
- condition — How good the condition is ( Overall )
- grade — overall grade given to the housing unit, based on King County grading system
- sqft_above — square footage of house apart from basement
- sqft_basement — square footage of the basement
- yr_built — Built Year
- yr_renovated — Year when house was renovated
- zipcode — zip
- lat — Latitude coordinate
- long — Longitude coordinate
- sqft_living15 — The square footage of interior housing living space for the nearest 15 neighbors
- sqft_lot15 — The square footage of the land lots of the nearest 15 neighbors
WHAT
What do we use to measure the presence of multicollinearity in a regression problem. A correlation matrix and variance inflation factor are going to be two of the most useful strategies to check for the presence of multicollinearity.
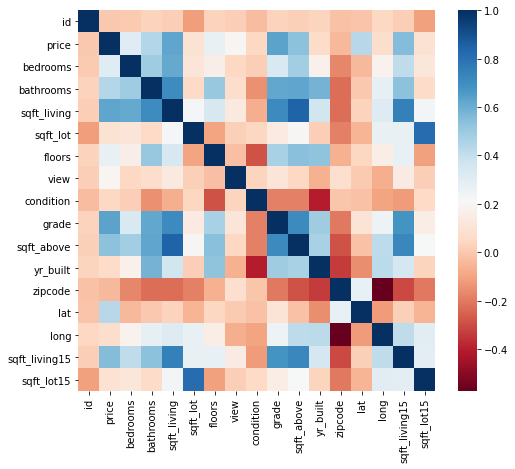
Correlation Matrix — A correlation is similar to a heat map. When created, the matrix assigns a range of colors based on how correlated two features are. Below is a correlation matrix of features from a data set based on housing data. Comparing features like bedrooms and bathrooms will account for that small patch of blue in the top left hand corner.
Variance Inflation Factor — Variance inflation factor is a way to quantify how much the variance has been inflated when running the model. I have a previous post where I introduce variance which can be found here. The error, or variance away from the predictive model inflates with a higher presence of multicollinearity. A variance inflation factor exists for each of the predictors in a multiple regression model. [2]
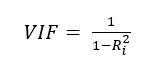
The coefficient of determination (or R squared) is a unit of measurement that is used to help gauge the VIF. This metric tells us how much variance is explained by the model. The R squared value is a number between 0 and 100. It is usually calculated from 0 to 1, or to the one hundredth decimal place, i.e. 87% would be 0.87. [4]
Here is where it gets tricky. VIF is then calculated on a scale of 1 or greater. How the heck does that work? Let’s continue with the example of a variable that has an R squared value of 0.87. Below are the calculations for it’s variance inflation factor.
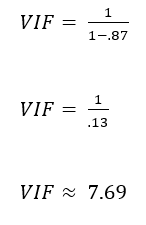
A general guide for interpreting VIF is below:
Looking at the chart above, if the VIF we calculated were associated with a real life variable, we should consider it for removal from the final model.
WHY
Why does it cause problems? More specifically, why does it cause the variance to inflate? The explanation for this mathematically gets extremely complicated and I don’t know that I am qualified at this point to get down and dirty on why exactly it happens. I can tell you a few things. You have two independent variables in conflict with each other. These variables on their own may have little to no impact on the model, however in combination with each other they could increase the affect on the model. Going back to having multiple recordings of square footage; if a form of square footage in a home is recorded 4 times it could create a bias towards that variable. The model is not a human that can discern that these are all essentially the same measurement.
HOW
How do we get rid of it work around it? Dropping columns is the obvious answer here but not always necessarily the right one. It’s important to be selective about the columns being dropped. The VIF score should give a good indication as to which columns to drop. Typically the idea is that one of the conflicting columns is removed. When considering columns to drop it is important to determine how similarly the offending features describe the outcome of the dependent variable.
Closure
I remember Multicollinearity being such an enigma to me when it was first introduced. I felt like I couldn’t wrap my brain around it, and even now I still have times where I have to slow down and think about what the mathematical implications are. For simplicity you could say that it is just when two independent variables are too closely related. That definition would not do the concept justice, however.
References
[1]https://statisticsbyjim.com/regression/multicollinearity-in-regression-analysis/
[2]https://online.stat.psu.edu/stat462/node/180/
[3]https://www.statisticshowto.com/multicollinearity/
[4]https://statisticsbyjim.com/regression/interpret-r-squared-regression/

