Christchurch the Chicago of New Zealand
Design a thing by considering it in its next larger context — a chair in a room, a room in a house, a house in a community, a community in a city… Eliel Saarinen

Executive Summary
Canterbury has a neglected transport system that isn’t fit for purpose, whether it be meeting New Zealand’s climate change goals or supporting Christchurch’s role as a strong second city for the country.
This think-piece looks at possible improvements to the region’s transport system by analysing the situation from three different perspectives:
- The problem of adapting the transport system for climate change and the vision of Christchurch being a strong second city.
- The historic context — is ‘back to the future’ the answer?
- Projects, network planning and sequencing — the theory and practice of implementation.
The Problem and the Vision
Christchurch, New Zealand’s second biggest city, is essentially the capital of the South Island.
The wider Canterbury region is New Zealand’s second most populated region, with the second largest growth prospects. Only Auckland is adding more people, houses and vehicles.
By 2048, Canterbury will have a population of about 780,000, according to an estimate by Statistics NZ. Wellington, currently the third largest region, will drop to fourth, with 612,000 people, and Waikato will reach 615,000 people.
*Note these estimates are only one possible outcome. I suspect all regions will exceed their population growth projections because, by 2048, New Zealand will be accepting climate change refugees.
As an important aside, regional decision makers should consider a range of change scenarios rather than basing policy decisions on one particular future population estimate.

In terms of carbon emissions, Canterbury is one of New Zealand’s most polluting areas. Car ownership and vehicle kilometres per capita are higher than most other regions.
In New Zealand, private transport is the fastest growing source of greenhouse gas emissions, growing at three times the rate of dairy or manufacturing.
The Canterbury population (0.65m) is just 37% of Auckland’s (1.7m), yet the region has 45% of the super city’s vehicle movements.
Regional data shows Cantabrians drive 10,900 km per capita per year, compared to 9,140 km for Auckland (16% less) and 7,840 for Wellington (28% less).
Data from the 2018 census shows Cantabrians drive and cycle to work at a greater rate than the national average, but are car passengers, walk, or use public transport at a lower rate. The travel to education data shows a similar pattern.
For New Zealand to reach its 2050 carbon-zero goals and avoid international trade sanctions for being a climate change laggard, rural Canterbury needs to reduce its methane emissions and Christchurch needs to stop emitting CO2. Both challenges are important, but fixes are easier for the urban environment because the solutions involve known technology (despite this, transport-related emissions are getting worse, not better).
Improving Canterbury’s transport system should be a long-term, strategic priority for New Zealand. It should involve the same amount of energy, reallocation of resources and commitment as earlier transport eras: the colonial and pre-colonial water-based era; the train, bicycle and tram era; and the state highway era.

New Zealand is a highly urbanised country — over 85% of the population live in an urban environment and virtually all population growth is urban-based. Canterbury has a similar urbanisation rate to other regions. In fact, Canterbury is more compact than Wellington (as can be seen in the above chart). Even with this advantage, the Christchurch urban area has higher emissions.
So, what is the explanation?
One answer is that Christchurch fills the ‘Chicago second city role’ in New Zealand’s hierarchy of towns and cities, yet this function is poorly recognised. As a result, the necessary spatial planning, multi-modal transport corridor protection, infrastructure provision and permissive planning regulations to enable urban development to orient around these corridors has not occurred.
A lack of spatial planning means Christchurch is the largest city in Australasia without mass rapid transit. The built environment has not orientated to multi-modal transport corridors and, as a consequence, public transport is poorly used.
At a national level, the lack of recognition for Christchurch’s role as a competitive second city has been bad for the environment and bad for the economy. Agglomeration enhancements have been missed and, because the city is not providing as many opportunities as it should be, housing-related inequality improvements have been hamstrung.

What is the ‘Chicago second-city role’?
Chicago is currently the third largest city in the US; for much of its history, it was the second. It is not the largest commercial city — New York takes that role — or the political capital — Washington DC has that position. Unlike Silicon Valley, LA and California, it is not the centre for the motion picture industry, broadcasting, social media or a particular type of technological expertise and innovation. Still, Chicago is a significant city for the US. For people and firms who want all the amenities of a big city but who have no need to be in the political capital, Chicago is an attractive proposition.
There are other parallels between Chicago and Christchurch; both are hubs for nationally significant rural hinterlands and have city histories of meatpacking and processing agricultural products. They have both faced large disasters: the Great Chicago Fire in 1871 and the Christchurch Earthquakes in 2010/11.
Chicago first adopted the second city moniker to describe the renewed city after the fire. More recently, it became a source of civic pride in response to a 1951 slur calling the city second rate. Chicago’s highly successful Second City improvisational comedy enterprise was about reclaiming the second city description as a positive.
By fulfilling its role, Chicago adds to the competitiveness between large cities in the US. This competitive tension helps keep urban markets healthy and in check — an important function.
Christchurch fills the second city role in New Zealand and has done for many generations. However, this has not been properly recognised. Often it is ignored, its significance downplayed, or the fact is contested. Wikipedia battles have even taken place over which New Zealand city is number two, requiring moderators to intervene to stop edits about city size and ranking.
To understand why Christchurch struggles to live up to its ‘Chicago role’, it is necessary to understand its spatial planning history. In many ways Christchurch in the 1920s would have been better positioned to address the climate crisis and to advance its second city role than the city of today.
Ōtautahi Christchurch spatial planning milestones
The water-era — From Pre-European times to 1867

Ngāi Tahu’s cultural mapping project, Kā Huru Manu, shows the interplay between early habitation patterns and the natural environment.
With its swamps, rivers and estuary, modern day Christchurch was back then an area primarily used for food gathering. The major Māori settlements were to the north and the south.
There are many lessons to be learned from the cultural mapping project. One intriguing story concerns the fall of Kaiapoi Pā in the early 1830s. After that happened, people shifted west to Tuahiwi. The name Tuahiwi means ‘the back ridge’, taking its name from the ridge that runs from Kaiapoi township to Rangiora.
Retreating inland to more solid land is what many Christchurch residents did after the earthquakes, too. Given the Ngāi Tahu shift to Tuahiwi, there may be merit in considering how the settlement can better fit into the Greater Christchurch spatial plan (discussed later in the paper).

Locating Christchurch on the Canterbury Plains instead of Lyttelton Harbour was the first major spatial milestone of the colonial era.
Captain Joseph Thomas, who oversaw the surveying of the new settlement, originally planned to connect the city and the port using water-based transport (this is well described in the article Canals through the Swamp). The plan involved coastal shipping from Lyttelton to the estuary and a canal linking the estuary to the city.

The 1850 city plan included a walkable city centre made of a grid of streets and a major green space (Hagley Park and the Botanic Gardens) on the western side. The total area was about 3km by 2km in size, measured from the surrounding boulevard streets (Bealey, Fitzgerald, Moorhouse, Deans and Harper Avenues). The town reserves on the northern, eastern and southern sides were set aside for future urban expansion.
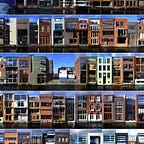
Being located on a plain, central Christchurch had 360-degree expansion potential. However, unlike Chicago the city did not set aside a wider network of arterial grid corridors, meaning it developed an ad hoc radial, or dendrite, arterial road system.

The proposed canals were never built. The space set aside for the city connecting canal is now a cycleway set in a green, boulevard road corridor.

The only rail line of the water era was the connection from the estuary to the city.
Passenger rail-era 1867 to 1934

In 1857, the Canterbury province decided to construct the 2.6 km Lyttelton rail tunnel, a major evolution of the region’s spatial plan. The Superintendent election that year had the rail tunnel as its focus, with the pro-rail candidate William Moorhouse winning the election. The tunnel was opened in 1867 and cost £200,000, which was financed by a provincial government loan. Canterbury had only 12,000 people in 1857, so land sales emerged as the best revenue source to repay the debt.
This was a practical application of Wakefield’s sufficient land price theory: the concept that adding infrastructure and amenity to land can raise its commercial value above a sufficient selling price. Land sales can then repay the incurred costs. In essence, this is a land value capture mechanism (the appendix includes a list of other mechanisms).
In effect, Canterbury had created an infrastructure provision model involving: democratic governance, evolution of the spatial plan and an infrastructure-funding mechanism.
It’s likely that Canterbury’s success with rail in the 1860s was a leading factor contributing to Vogelism in the 1870s (massive expansion of the railways as a nation-building exercise).
Premier Julias Vogel’s greater centralisation of transport provision had undoubted benefits, including standardisation of the rail gauge. However, the scheme wasn’t as successful as it could have been.
Vogel wanted over 2 million hectares of ‘waste’ land around his proposed rail corridors as a Crown endowment. This would have allowed the Crown to own land close to the newly constructed rail corridors which it could then sell at high prices to fund the infrastructure costs. In 1873, Parliament voted against the measure. Vogel’s scheme couldn’t capture the value it created, meaning infrastructure expenditure had to be financed by central government debt repaid from general taxation.
As it eventuated, Vogelism created a disconnect between infrastructure provision and local land use effects, because the local households, farms, firms and workers didn’t contribute towards the benefits they received. The wider New Zealand public purse essentially subsidised large increases in private land value. This is part of a long-term pattern of New Zealand being addicted to land speculation which is a fundamental weakness to its economy and society.
The disconnect between central government infrastructure provision and its land use effects may seem like an obscure historic fact, but it’s an issue the government has yet to resolve more than 150 years later.
The cost-benefit tools that government transport agencies use to prioritise new transport projects do not consider land use effects despite repeated recommendations by experts that they should. What transport projects New Zealand selects is largely a political choice as the previous link describes. More formal tools like funding being based on revenue obtained from tolls, congestion charges, car parking fees, or capturing rising land values have been ignored. Transport spending has been politicised meaning techniques to provide a more consistent pipeline of work and to contain costs have been ignored. In many areas New Zealand has significantly higher build costs than other developed countries — the New Zealand Infrastructure Commission identified cost premiums for four types of complex, large-scale projects: urban and rural motorways, road tunnels, and underground rail projects.
As Colonial Treasurer (1870 to 73) and as Premier (1873 to 76), Vogel championed the building of over 2000 km of rail by 1880. It was financed by public debt, which doubled from £7.8 million in 1870, to £18.6 million in 1876. Repaying the debt in the following decades probably exacerbated the 1880s Long Depression.
For Canterbury, the wider rail network quickly followed on from the decision to build the Lyttelton tunnel. The southern line was established before the tunnel was opened in 1867; the northern line was added five years later by 1872.

The provincial government system was abolished in 1876. By that time the Canterbury province was in good financial health as land sales had repaid the tunnel debt.
Despite the political restructure, the rail network continued to expand.

However, the railways included some major spatial planning flaws which were never remedied. The off-centre location of the central train station has long been considered suboptimal. In 1868, The Press newspaper wrote a whole editorial on the topic, stating “Christchurch station would never be accepted as Christchurch except on a railway ticket”. There have been various spurs and loops suggested since 1868 to correct the off-centre problem, but never to the point where the necessary corridor protection and funding mechanisms were established.
Rail-era — bicycles are added from 1880
By its very nature, rail complements other transport modes. From the beginning, walking to the railway station was the norm.
In Canterbury, bicycles were quickly adopted into the local transport system.

Even before the Christchurch earthquakes, the city had fewer high-rise buildings than Auckland or Wellington. This doesn’t mean the city lacked agglomeration opportunities. Christchurch’s history of cycling and women’s suffrage is an example of the agglomeration benefits the city achieved in the past — a critical mass of networked people was able to share new ideas.

Women in Christchurch were quick to use bicycles in the 1890s to advance the suffragette movement. In 1892, The Canterbury Times reported there were 4000 cyclists in Christchurch out of a population of 51,000. According to the paper:
everyone cycles — both sexes, all ages, all ranks. Ladies make calls thirty miles out…. There were lady cyclists in Christchurch when they were practically unknown in other parts of the world, and they cycled in knickerbockers, and tasted the freedom of the reform dress when their sisters elsewhere were merely talking of it in whispers.

The suffragette campaign to get women the vote was led by Kate Shepherd and her Christchurch supporters. The major success of this campaign was organising a quarter of the nation’s women to sign a petition demanding the right to vote. In 1893, New Zealand became the first self-governing country to grant all women that right — to vote in parliamentary elections. After Otago/Southland, Canterbury had the highest number of signatures.
Christchurch’s city centre has the most access points of any comparable city in New Zealand. Due to the city expanding in all directions, a larger number of people are able to live within 3–4 km of the city-centre and still have easy access to the amenities it provides. Combined with Christchurch’s flat terrain, this makes the city ideal for cycling. In the past, Wellington and Auckland didn’t have as many people living within such a convenient cycling distance, although Auckland’s city centre growth in the past eight years has now overtaken Christchurch.

Rail-era — Trams are added from 1880

Right from the start, Christchurch’s trams shared road space and intersections with other road users. When buses replaced trams in the 1930s through to the 1950s, routes largely remained the same.
Passenger trains were different: they didn’t share the rail corridor with other modes and they had the priority where tracks crossed roads. Trains could therefore travel at higher speeds and their travel times were more reliable as they weren’t affected by road congestion.
Christchurch’s trams and trains were an integrated public transport service — one fed the other. Trams provided a solution to the city’s off-centre rail station problem. In 1880, Christchurch’s first steam tram provided a service from Cathedral Square to the Christchurch railway station on Moorhouse Ave via Colombo Street; shortly after, another service was added via High St.
Tram services were initially run by private companies, but electrification required more capital so, from 1905, they were built by municipalities. Local government funded the electrification and the expansion of tramlines by taxing property by charging rates on land titles and its capital value (another land value capture mechanism).

Up until 1926, urban growth in Christchurch largely followed the train and tram lines. It was a successful period for the city. Its local government could afford to fund the infrastructure needed for growth and rents were affordable for residents (renting in Wellington cost 45% more at the time).

Transition era where modernisation of the multi-modal transport system stopped — from the 1930s
To achieve a low-carbon future in New Zealand, some people have argued we should look to the past. The country once had thriving towns and cities with multi-modal transport systems, yet we have largely turned our back on this history. This is especially true for Christchurch, where there appears to be little institutional memory of its multi-modal transport past.
In his groundbreaking study Lost City: Forgotten Plans for an Alternative Auckland, urban historian Chris Harris dates the turning point to 1950. Both major political parties now agree it was a historic, generational mistake not building ‘Robbie’s Rail’ in the 1970s. A consensus has emerged that Auckland is now paying the price for underinvesting in multi-modal transport systems post-WW2.
Business journalist Bernard Hickey dates the turning point to 1989 for provincial New Zealand in his article The answer to NZ’s transport future lies down a long tunnel in Whanganui. Until they were wrecked in the early 1990s, provincial cities had thriving public transport systems, Hickey contends. Car ownership was less than 300 per 1000 people until the 1970s (it is now over 900 in Canterbury). The Public Finance Act and the Reserve Bank Act changed this, Hickey argues. The driving forces behind this reforming period were to reduce government debt, cut taxes and make users pay for as many public services as possible, including public transport.
As a side note the ideology of users pay thinking was that passengers should pay for the full cost of public transport services. ‘Users’ did not include all beneficiaries from transport spending. For instance, it did not consider land-use effects as a part of the ‘users pay’ framework.
This report makes the case for the 1930s being the point when progressive improvement of Christchurch’s multi-modal transport system stopped.
The history of Christchurch compared to Wellington illustrates why this earlier date might be more accurate.
The two cities are a similar size (it was only in recent decades that Greater Christchurch pulled ahead). Despite their similar populations, they have very different spatial planning histories. This is important because urban development has a hysteresis aspect to it (hysteresis means the state of a system depends on its history). In other words, the past and pathway dependency are important parts of transport planning.
It was in the 1930s that the transport paths of Christchurch and Wellington began to deviate. The former took the spatial planning road to car dependency while the latter managed to keep multimodal pathways going — just.
Parliament made two key transport-related decisions that changed the future transport system make-up of Wellington compared to Christchurch.
First, there was the 13.5 km electrified and double-tracked Tawa Flat deviation, involving two tunnels of 1.2 km and 4.2 km in length. This project was approved by the Railways Authorisation Act in 1924, which meant it was paid for by central government. When it opened for passenger trains in 1937, the deviation reduced the travel time from Wellington to Porirua by 15 minutes. This has been further reduced to the current travel time of 21 minutes.
World-wide evidence shows being able to travel to a destination in under 30 minutes is valued by commuters; the improvements to the Wellington-Porirua line underpinned the success of rail in the capital.

Second, the Hutt Valley Lands Settlement Act of 1925 provided the legislative framework for the Petone-Waterloo line to be paid for by the betterment of the land it served (i.e. another land value capture mechanism). The Act set in motion the process that culminated in a double-tracked, electrified commuter railway through the Hutt Valley.
For Wellington, those Acts from the 1920s created a V-shaped linear spatial plan that extended Greater Wellington to Porirua and the Kapiti Coast in one direction and up the Hutt Valley in another. Without these spatial planning interventions, Greater Wellington would not have its current built form.
These V-shaped multi-modal transport corridors have had many flow-on effects, in particular the Wellington region’s much lower transport related greenhouse gas emission profile. It also included the First Labour Government’s successful house building programme in the Hutt Valley and Porirua where earlier government house building programmes in Petone had failed.
In the decade to 1947, New Zealand built social housing at a rate of 1.55 per thousand people. Today, that would equate to a state build rate of 7,750 homes per year — three times Kainga Ora’s current output.
However, the central government of the time didn’t replicate the successes of these Wellington multi-modal transport corridors in either Auckland or Christchurch.
In Australasia, the first electrified suburban rail service started in Melbourne in 1919. It was an immediate success, with patronage soaring as a result of quicker travel times and more frequent, cheaper services. Sydney followed shortly after.

New Zealand’s first electrified suburban rail line was built in Christchurch in 1929 between Lyttelton and the city; its primary purpose was to better manage tunnel operations.

Parliament decided against electrifying the rest of Christchurch’s suburban rail network based on the recommendation of the 1925 Merz & McLellan report. While the cost to electrify Christchurch’s rail system was less than Auckland or Wellington, traffic volumes and the estimated annual coal use savings were considered too small to justify the capital investment. Improving the network effect of local transport infrastructure provision and the land-use effects of orientating urban development along rail corridors were not considered.

Greater Christchurch had one last shot at modernising its multi-modal transport system with electric battery trains.

In the 1920s, NZ Railways experimented with a number of different railcars. The most successful was the Edison battery electric railcar, which ran between Christchurch and Little River via Lincoln for eight years through to 1934. The service, which had a travel time to Lincoln of about 25 minutes, received rave reviews and write-ups. Germany successfully used more powerful electric battery trains after WW2 and new electric battery trains are being produced today, proving the concept was viable.

Electric battery trains could have been a good option for Christchurch as a transition towards a fully electrified suburban rail service.

A modern commuter rail network bounded by Lincoln in the south, Rolleston in the south-west, Lyttelton in the south-east and Rangiora in the north was clearly possible.
Unfortunately, when the electric battery railcar was destroyed in a 1934 fire it was not replaced. This marked the final milestone of the rail era. From this point onwards, improvements stopped and — as each piece of rail infrastructure reached the end of its economic life — the service was closed.
The Lincoln line reverted back to steam engines after the 1934 fire. During the 1951 waterfront dispute, the resulting coal shortages meant that train services were stopped. They never started again.
The official reason for not replacing the battery electric train was the financial situation of the Great Depression, but Parliament had no problem funding the far more expensive Tawa deviation. Land value capture techniques could have been used to assist with funding. For whatever reason, Wellington was prioritised over Christchurch. Perhaps the capital needed more help, or maybe the politicians of the time thought Christchurch was a provincial town that should focus on freight exports. It’s hard to know. What’s more certain is the spatial planning consequences that followed these decisions, including Christchurch’s ensuing dependence on the private car.
State Highway era — 1936 to 2021
In the 20th century, New Zealand’s central government took more control over the national road network.
The Main Highways Act of 1924 created the Main Highways Board, which was given control of roughly 10,000 km of roads designated as main highways.
Central government initially contributed about 50% towards the Highway Board’s costs via funding mechanisms including petrol taxes, car registrations and mileage taxes (now called ‘road user charges’). Local authorities funded the remaining 50% from rates and driver licence fees, which they collected at the time. In 1936, central government began covering all the costs of main highways, which were renamed state highways.
At some point last century, the government further centralised control over the national road network by contributing 50% of the funding for local roads, too.
This centralisation created a significant problem. Funding transport projects from road user charges and having this allocated by a central authority contributed to the disconnect between transport funding, project prioritisation and local land use effects.
Christchurch in the second half of the 20th century is a clear example of this.

Central government proposed a regional spatial plan for the city including a series of motorways connecting the north, south and port areas via the central city.
The motorway plan could have looked something like the Welsh example depicted in the image below.

Local Christchurch politicians campaigned against the intrusive plan because they believed the motorways would be a blight on the city, not a benefit.
Numerous motorway proposals were put forward, and eventually the northern and southern motorways were built — but well away from the city centre, unlike Auckland and Wellington.

Maybe this opposition to the motorways explains the fact that, at the start of the 21st century, Canterbury received less funding for transport projects than the amount leaving the region in vehicle taxes.
Canterbury’s transport history shows the state highway era and its associated funding model hasn’t been good for the region relative to other New Zealand cities.
One solution for fixing Canterbury’s emissions problem and improving recognition of Greater Christchurch’s second city role is obvious. Canterbury should receive its fair share of transport funding, and this funding should go towards fixing its 100-year history of underinvestment in multi-modal transport systems.
Mass-transit era — from 2021 to 2050?
A 2021 study investigating mass rapid transit (MRT) options for Greater Christchurch found a rapid transport system would be viable for the city, but it would need to be supported by intensive population growth along the identified corridors.
Planners are considering three scenarios for mass rapid transit: passenger rail on the existing heavy rail corridor, and two street running options using either buses or light rail. The MRT report didn’t identify a preferred mode.
*Note the MRT report suggests a longer rail tunnel than the short spur tunnel which is detailed later in this paper. The MRT report tunnel being a spur from Riccarton Ave to the city with two stations: one at Christchurch Hospital and another at the bus exchange.
Given the narrow width of arterial roads in areas like Merivale, Papanui and Riccarton, street-running light rail or rapid bus schemes would likely face difficulties constructing a separate corridor that doesn’t share space with other road users. If mass rapid transit doesn’t achieve space separation, the service won’t be fast, frequent and reliable — the three key characteristics needed to incentivise mode shift.
Putting light rail down Papanui or Riccarton roads would likely face even more difficulties than Auckland’s proposed Dominion Rd scheme (which has parallel arterial roads other modes can still utilise). Widening Christchurch’s roads and creating an intensive, boulevard-style light rail scheme would be possible, but it may not attract sufficient support, which would stall all spatial planning for the city.

In my opinion, for Canterbury to develop a better transport network, it should repeat its past by establishing passenger rail on the existing tracks as a first step in building the mass transit era. Bus priority services and future light rail upgrades could then provide a supporting or feeder role. Especially for the city centre connection if the below discussed rail spur to the central bus exchange is not built.
To be clear, this paper proposes passenger rail on the existing tracks and street-running bus priority services that can be upgraded to light rail when demand makes this viable. In contrast, light rail advocates propose going straight to street-running light rail without reinstating passenger rail on the existing railways.
In my opinion, going straight to light rail would be more expensive, disruptive, controversial and more likely to result in delays compared to making incremental improvements to passenger rail.
Projects, Network Planning and Sequencing
Learning from the past
If Canterbury had a ‘carbon-zero by 2050 transport project’ there’s a good chance it would result in similar decisions to the ones made in Wellington in the 1920s (these decisions, described above, laid the groundwork for Wellington having 28% less transport-related emissions per capita).
What projects?

The Christchurch equivalent of the Tawa Deviation is central government funding a city centre rail spur tunnel (Britomart model), or a surface tram-train loop track (Karlsruhe model). Both options have the potential to open up four suburban rail lines.

This rail spur could be integrated with the Christchurch Bus Interchange to create a combined bus/train station. Should the project go ahead, the train tracks between Addington and Moorhouse stations could be dropped into a trench, removing five level crossings and lowering two bridges.
This would improve safety and increase train speed. Lowering tracks has a number of advantages:
- It improves placemaking. For instance, if the Colombo St overbridge was lowered to ground level this would reduce Sydenham’s severance from the city centre, leading to a potential, regenerated SoMo (South Moorhouse) district.
- Passenger trains wouldn’t delay bus priority services on Lincoln Rd. It also protects the grade-separated nature of the road/rail intersection for future bus rapid transit or light rails upgrades if/when required.
- Train station platforms can extend under the arterial road, meaning pedestrians can access the station without crossing the road.
- If trenched train stations are successful for Addington and Moorhouse it could provide a template for other stations near level crossings and bus priority services, like Riccarton Rd.
New Zealand has experience rail trenching. It was done well in Auckland, for example, in New Lynn.

In Australia, Melbourne has a programme of removing level crossings to create high standard public realms that improve conditions for pedestrians, cyclists and other public transport modes.
If the city centre spur or loop is built and the upgrades to Christchurch, Moorhouse and Addington stations occur as suggested, this raises the question of what to do in Middleton and Waltham. Both sites are currently used by KiwiRail for train maintenance or freight operations.

Recently, the Transport Minister announced a new South Island Mechanical Maintenance Hub to be built at Waltham. Instead, this report suggests government direct KiwiRail to transfer its industrial operations to a new hub near the inland port at Rolleston.
KiwiRail has previously said it has no plans to move its Middleton operations, even when it was suggested the site could make room for 1600 homes. This isn’t unexpected. KiwiRail is more focused on freight than passenger rail, and New Zealand Rail has a history of being divorced from land use effects.
A dearth of local expansion sites combined with rising urban land prices should be a signal for industrial rail activities to move to more spacious, peripheral city locations. Inner city sites should be developed more intensively, for both commercial and residential uses. This is already happening on other parts of the rail corridor. Lyttelton Port Company has moved its container terminal from Heathcote to an inland port near Rolleston; The Tannery, near the railway line in Woolston, has been regenerated from an actual tannery to a high-quality retail environment.
A review of other old stations on the Lyttelton line shows good potential for brownfield developments on disused industrial land. The National Policy Statement on Urban Development (NPS-UD) allows areas within walking distance of rapid transit to build up to six stories by right. It also removes minimum car parking requirements, so many of the legal barriers for intensifying such sites have been removed.
The second Wellington spatial planning success Christchurch could replicate is something like the Hutt Valley Land Settlement Act. This would allow new greenfield urban developments to be concentrated around multi-modal transport infrastructure.
Repeating the success of the Hutt Valley example to the north of Christchurch would be quite simple. There are a number of good greenfield locations along the existing rail corridor suitable for train stations and urban development. To do this well, the corridor needs to be double-tracked and electrified. Land should be acquired for stations as well as land for a network of street spaces prioritising pedestrians, cyclists, micro-mobility devices and bus feeder routes. As per the Hutt Valley example, land could be acquired in advance for future housing and mixed commercial uses then sold as a land value capture tool.
From a spatial planning and urban design perspective, there have been many lessons since Hutt Valley was built. Developments like Vauban in Germany and Houten in the Netherlands, for example, have much fewer private vehicles than Wellington and less than half the rate of Canterbury.
A good multi-modal transport orientated development 3km outside Christchurch’s current urban limits would be better, both environmentally and socially, than a poorly designed infill development.

Harking back to Ngāi Tahu’s past settlement patterns, a rail loop or alternative route could be built to better connect Tuahiwi with Kaiapoi and Rangiora. Should Ngāi Tahu be interested, this would provide options for new train stations and a new township. As part of its Treaty of Waitangi settlement, the iwi was given land at Tower Junction, formerly the Addington rail workshop. Ngāi Tahu could encourage more residential settlement in Tuahiwi via a rail link to Christchurch — a modern interpretation of the iwi’s historical spatial movements.
To the south, the situation is a little more complicated.

New passenger rail stations between Hornby and Rolleston are unlikely to be viable because residential housing cannot be built in this corridor due to the airport noise zone. The corridor is used for industrial purposes and that is likely to continue, meaning any new stations would only service low intensity industrial areas.
Residential Rolleston will continue to grow, though. Planning for the future needs of pedestrians, cyclists, micro-mobility device users and bus feeder services is crucial. Any plan needs to include good quality access to a rebuilt train station. This report highly recommends future-proofing Waka Kotahi NZ Transport Agency’s planned SH1 flyover and the changes proposed for busy Rolleston intersections (Waka Kotahi is currently seeking public feedback).
The area between Hornby, Halswell, Lincoln and Rolleston is one of the fastest growing urban environments in New Zealand. This is the greenfield area closest to the centre of Christchurch (it’s similar to the distance between Lower Hutt and Wellington). If this area is unplanned and the existing roads are the only transport mode option, then the future of each township will be car-orientated sprawl until they merge together.
There are different, better spatial planning options. For instance, the whole area could be divided into a grid of arterial roads except for environmental no-go zones. The roads could be future-proofed for rapid transit, bike lanes and other multi-modal transport options (this would be like the Chicago image depicted earlier in the report).
This report, however, has chosen to depict a Copenhagen-style finger plan for the area (although there is an arterial grid aspect to how these fingers connect to each other).
From Hornby towards Lincoln, the rail spur currently extends only as far as the motorway. A rail bridge over the motorway and new greenfield tracks to Lincoln would be required. This would be easier than the 1920s Petone to Waterloo line which required a bridge over the flood-prone Hutt River.
The rapid transit line from Halswell to Lincoln could start out as a designated road corridor, perhaps for the exclusive use of a battery-powered, rapid electric bus service. This could be upgraded to light rail if required.
The upward and outward expansion possibilities around the train lines inside Christchurch’s existing footprint combined with new greenfield, transit-orientated developments could cater for at least double the existing population. Having more development-ready sites would also keep land prices competitive.
To do this, though, there needs to be a shift from just-in-time infrastructure planning to a more advanced, strategic planning model.
Network planning

Unlike when it was established, Greater Christchurch can no longer grow in all directions. The sea, the Port Hills, flooding and liquefaction prone areas, the airport noise zone, and — further to the west — the water recharge source of the city’s aquifers, all restrict the city’s outward expansion. The public also wants to see pockets of arable land with rich soil protected against urban encroachment.
Fortunately for Christchurch, the city has been well-served by its ‘apple’ shape. It has fewer transport choke points than Auckland and Wellington, meaning residents can drive more on a per capita basis without experiencing as much congestion.

Going forward this advantage is likely to fade as growth will be focused in two directions.
In 20-or-so years, congestion pricing in Christchurch would likely generate more revenue than Wellington because Christchurch will have drivers who travel further, own more cars and the city has faster growth prospects. This will be especially true if Christchurch does not receive investment in a multi-modal transport network. Mass transit can relieve road congestion pressure because grade separated transit and active mode transport networks have higher capacity to respond to induced demand.
For congestion mitigation alone, Greater Christchurch — with its future ‘banana shape’ — will need to achieve the mode shift seen in Auckland and Wellington. To meet its carbon-zero 2050 aspirations, it will need to go much further.
Rebuilding commuter rail in Christchurch will add a north-south and east-west grid overlay to the transport system. This is useful because grid patterns have more connectivity and flexibility than radial systems. As they grow, many cities add grid connection features if that wasn’t already a feature of their spatial planning work.
Sequencing
The first step is to separate out long-term spatial planning from short-to-medium-term infrastructure project delivery.
Current reforms to replace the 30-year-old Resource Management Act with a Strategic Planning Act and a National and Built Environment Act will hopefully prompt Canterbury to undertake some proper, regional-level spatial planning. Nationally, the plan is for the existing 100+ RMA council planning documents to be reduced to about 14.
In partnership with central government agencies, Canterbury could pursue longer-term spatial planning with intergenerational effects, like New York’s 1811 Commissioner’s Plan that designated a road grid for Manhattan Island; the grid was later able to accommodate the subway network. This plan was a critical step that allowed New York to become both the largest and densest city in the US and have a lower rate of transport-related emissions than Auckland (on a per capita basis).
Spatial planning has been successfully done around the world, including Barcelona’s 1859 Cerdà plan. In Canada, Ontario’s designation of north-south and east-west paper roads in the late 19th century were adapted into a grid system of frequent public transport services in Toronto. Copenhagen’s 1947 Finger Plan concentrated development into multi-modal transport corridors while protecting the ‘green wedges’ in between.
New Zealand’s failure to properly plan its cities and urban growth areas is shown by the fact that only 9.5% of homes built in 2019/20 had access to frequent public transport services, according to the Ministry of Transport (quote on page 22 here).
The impacts of poor spatial planning include:
- Vast cost escalation. Infrastructure Australia found tens of billions of dollars of cost escalation because the corridors protected in the 1950s, 60s and 70s were built out in the 80s, 90s and 00s. New Zealand is in the same situation.
- Inability to build transport projects, provide congestion-free alternatives and reduce emissions because there isn’t enough room on public rights-of-way (arterial roads in New Zealand are frequently too narrow to fit rapid transit and active mode infrastructure).
- Housing supply constraints that cause shortages, unaffordable homes and overcrowding.
- Less urban development from the infrastructure projects that are built, reducing their uptake and benefits.
The flow-on social impacts include:
- Increasing inequality (a landed gentry and a renting class).
- Lost agglomeration opportunities and lower wages because of congestion and disconnected labour markets.
- Reduced flexibility to repurpose transport systems to reduce emissions.
- Increased risk of economic depression from overinflated urban land prices.
- High infrastructure costs require higher taxes and provide lower value-for-money. The opportunity for infrastructure providers to pay ‘today’s price tomorrow’ is lost.

The general spatial planning solution is:
- Plan, protect and pay to acquire land for a grid of corridors and public open spaces so that cities have the capacity, if needed, to double or treble in population size over an extended timeframe (through both urban intensification and competitive urban expansion).
- The corridors should be connected (grid-like) and spaced about 1 km apart. Each corridor should be about 30 metres wide.
- The societal impacts of spatial planning are national and intergenerational, therefore oversight of this should be the responsibility of a central government agency, although the work should be undertaken in partnership with local entities.
What does this mean for the sequencing of mass transit?
For Greater Christchurch to achieve a comprehensive mass transit system, will require planning for, protecting and funding the purchase of land corridors up to 30-years or more in advance of any actual construction.
Implementation should be staged and based on demand and land use effects, with land value capture tools used as a source of funding. Hopefully each stage provides the spur for the next stage.

Further stages are possible if demand allows.

This paper is effectively part one of a two-part series, as it mainly focused on Christchurch’s spatial planning history. Part two will be more future focused — it is called What Could Mass Rapid Transit in Christchurch Look Like?
Community review
This paper is not an academic article and has not been through a peer-review process. However, the material has had input from a wide range of people, including the Canterbury Housing and Transport discussion group (CHAT Club), which provided many of the images and maps; private discussions with urban economists; and online feedback from a historian, transport planners, Ngāi Tahu members and the wider public. I want to thank everyone who contributed; your feedback has greatly improved the finished product. Greater Christchurch’s transport system needs to change — to meet our climate change obligations and to make Christchurch a better, more liveable city. I hope this paper encourages discussion about how that should happen.
Appendix
After the passing of the Hutt Valley Lands Settlement Act in 1925, 253 hectares (625 acres) of land was purchased for development, of which 12 ha (29 acres) was for the railway, 32 ha (80 acres) for the workshops, 55 ha (135 acres) for roads and other amenities, and 177 ha (438 acres) for housing. Source


Land Readjustment: Kashiwonoha Campus Station Case Study

Kashiwonoha campus station is located 32 km northeast from central Tokyo. The campus station land readjustment project is part of the Tsukuba Express suburban railway that opened in 2005. This is a 58.4-kilometre line which offers 130 kilometre an hour passenger services between central areas of Tokyo and multiple satellite towns, such as, Kashiwonoha Campus town. The whole Tsukuba Express project adapted the land readjustment concept with the addition of zero-interest loans, as well as some public assistance to together finance the roughly $7.5 billion cost of construction. There were 18 land readjustment districts, accounting for about 2,903 hectares around 13 stations.
The campus station land readjustment project began in 2000 by Chiba prefecture when it designated a 272.9-hectare district occupied by a golf course, fields, forested hills, and small factories. Through readjustment, the large area has been converted into developable land parcels for residential, commercial, industrial, educational, and social service uses served by roads, utilities, parks, green spaces, and a new railway station. Land readjustment covered 63% of the $893m cost. Residential demand and retail opportunities (a new shopping mall) facilitated by Mitsui Fudosan Corporation; an original owner of the former golf course were key drivers of the project. Local educational facilities (two university campuses) added further value.


Looking even further forward there is ten times the amount of funding dedicated to planning rapid transit for Wellington and fifteen time more for just one light rail rapid transit project in Auckland compared to Christchurch’s public transport futures programme as detailed in the below OIA request.
Request made under the Official Information Act (OIA)1982
Thank you for your email of 12 July 2021 requesting information about the Auckland Transport Alignment Project (ATAP), Auckland light rail, Let’s Get Wellington Moving and Christchurch’s public transport futures programme of work under the Official Information Act 1982 (the Act).
I appreciate your patience with the time taken to respond to your request and understanding the competing priorities faced by the team responsible for reporting this information.
As you are aware, the programmes and projects you have asked about are vastly different in scope and size. ATAP encompasses all transport spending for Auckland, and figures for this include figures for Auckland Light Rail. Let’s Get Wellington Moving is a large programme and includes multiple transformational projects but does not include all transport spending in Wellington. Christchurch’s public transport futures programme has a smaller scope then both of these.
1.Since its inception to-date, how much money has NZTA spent on Auckland Transport Alignment Project planning (this includes all business cases/consultation/research etc).
2. Since its inception to-date, how much money has NZTA spent implementing the Auckland Transport Alignment Project.
3. Since its inception to-date, how much money has NZTA spent on Auckland light rail planning (this includes all business cases/consultation/research etc).
Since 2015–16 to 9 September 2021, the total spend from the National Land Transport Fund (NLTF) on ATAP planning is $268.9 million. This includes $40.1 million that has been spent from the NLTF on the Auckland Light Rail project.
Implementation for ATAP started in 2018/19. Since 2015–16 to 9 September 2021, the total spend from the NLTF on ATAP implementation is $4,080.7 million.
4.Since its inception to-date, how much money has NZTA spent on the Let’s Get Wellington Moving programme (this includes all business cases/consultation/research etc).
5. Since its inception to-date, how much money has NZTA spent on implementing projects in Let’s Get Wellington Moving.
Since its inception in 2016 to 30 June 2021, the total spend from the NLTF on the Let’s Get Wellington Moving programme is $28.6 million. This excludes costs borne by the programmes funding partners Wellington City Council and Greater Wellington Regional Council.
This is the total cost and includes staff costs, investigations, consultation and business case development.
All of the costs noted above are part of the ultimate process of implementing the programme, but physical construction has not yet started. There are no implementation costs from the NLTF as at 30 June 2021.
6. Since its inception to-date, how much money has NZTA spent on Christchurch’s public transport futures programme of work (this includes all business cases and associated business cases, such as the MRT work/consultation/research etc).
7. Since its inception to-date, how much money has NZTA spent on implementing projects included in Christchurch’s PT futures programme of work?
Since its inception to 9 September 2021, the total spend from the NLTF on Christchurch’s public transport futures programme of work is $2.7 million.
The costs noted above are part of the ultimate process of implementation, but physical construction has not yet started. There are no implementation costs from the NLTF as at 9 September 2021.
If you would like to discuss this reply with Waka Kotahi, please contact Andrew Knackstedt, Senior Manager Media, by email to Andrew.Knackstedt@nzta.govt.nz or by phone on 04 894 6100.