Requests analysis for public utility in Minsk
115.бел requests: the largest data set on public utilities in Belarus.
Recently the utility sector in Belarus was reorganized. Now all the contacts between citizens and service providers run through a centralized system, which allows submitting one’s request via the app, a telephone call or the web site. This system collects large amounts of very detailed data. In addition to its direct and very pragmatic purpose, which is utility provision optimization, this information has a huge field for application in the public sphere.

115.бел is a centralized country-wide Belarusian online public service for all the housing maintenance requests. The following makes it very important:
- Citizens can directly communicate with service organizations through a centralized system that collects all the data.
- This is an unprecedented chance to increase efficiency and openness in the utility sector.
- Another chance is life quality evaluation and understanding of the main problematic issues.
- Patterns of local activity and differences in perceptions can be studied on a vast scale.

Representativeness
The complete dataset has 4+ million applications, including:
- requests from the mobile application and website from 2015 to 2017 (total 120K applications) for Minsk only
- applications from the mobile application and website from 2017 to January 2020 (a total of 260K applications) throughout Belarus
- applications received by telephone 115 from October 2018 to January 2020 (a total of 3.7 million) throughout Belarus.
This amount of data is enough to reflect the real situation.
Analysis
Users assign the topic to the request on their own, existing categorization is too sprawling and not goal-based. To get a better grasp of the data set requests are analyzed in three sections:
- thematic categories;
- building age and housing typology;
- location in the city.
Section 1. Thematic categorization
To make sense of the data at hand a clear request rubrication is needed. The most logical step is to organize them into several thematic categories:
- children comfort and safety;
- parking;
- accessibility of the urban environment;
- landscaping and greenery;
- multi-factor safety.
The goal is to translate raw data into human language.
Section 2. Age and housing typology
Building age and housing typology to a large extent determine request distribution in Minsk. The city was developed using typified mass housing during both the Soviet and Independence periods. This makes housing typology the key factor in determining the living experience for citizens.
- Requests analysis, organized in these two sections allows for a more adequate assessment of the individual building conditions. Characteristic problems can be identified. For example, low-rise buildings of the post-war era are predictably in worse condition and require specific repairs. Similar insight can be gained about the state of the other housing typologies.

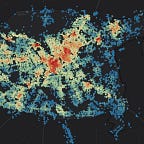
Section 3. City-wide requests distribution
In Minsk, the main spatial reference framework for both residents and urban planners are microdistricts (housing estates or neighborhoods). Organizing data at this level is crucial in a sensible analysis of the typical needs and problems of each housing typology. On the other hand, it helps to visualize real differences in the situation in a way that is understandable to the inhabitants, as it refers to their lived experience in the city.

These preliminary findings demonstrate that data, collected by a public housing maintenance service (115.бел) can be used to gain insights that vary in scale and nature. Significant public value in accountability and transparency is readily visible too.
Our research continues, we are working on a deeper exploratory analysis of the whole data-set and better, more precise request categorization. We are planning to roll out a series of thematic maps visualizing the state of key life quality defining areas, such as safety and accessibility.
A project by: Anton Zhyltsou (link), Dzmitry Bibikau (link) and Eugene Kalinouski (link).