Google Maps ratings as an indicator of quality of life
How can we use Google Maps’ Point of interest (PoI) ratings as an indicator of quality of life?
Assessing the quality of life in a city requires an integrated approach. However, crafting and conducting a city-wide survey that would provide this valuable information takes an immense amount of time and energy. Fortunately there is already a vast archive of citizens’ opinions and feelings about all sorts of things that is readily accessible: their reviews and ratings online!
Some destinations in a city are widespread and actively respond to changes in residents’ purchasing power by changing their quality of service. These destinations often include banks and post offices, hairdressers and groceries, etc. These places are frequented by residents and therefore well-characterized by reviews on the internet, reflecting both impressions from the service and the general mood of their visitors. They depend on their immediate urban surroundings and contribute to their area’s character, and for this reason they serve as indicators of quality of life.
Grocery ratings as an indicator of quality of life

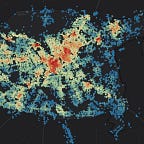
Above one can see groceries with Google Maps ratings mapped (link). Groceries with larger numbers of reviews tend to have higher ratings (higher quality flagship stores?), higher rated stores tend to be located close to the city center and in locations with good transportation accessibility, and they are often located near metro stations. Concentrated areas served by groceries with poorer ratings stand out also. Some other trends can be traced as well, but in general, it is difficult to assess the situation throughout the city.
Life quality: plotting over housing
Now that we have grocery ratings and their spatial distribution, let us plot them over residential buildings to understand the store “ranges” and how these are distributed. Results can be explored online (link), points indicate individual residential buildings and color indicates average grocery ratings in the immediate vicinity.
Transit accessibility is very influentual: not only the distance to the city center and transportation accessibility alone, but the location within the larger street network as well. Low ratings are concentrated in the middle and peripheral zones of the city. Concentrated areas served by groceries with poorer ratings stand out again and the data shows`, that they are quite compact.

Life quality: finer scale
On a finer scale, concentrations of housing served by high-rated grocery stores are clearly visible and can be explored online (link). Transit accessibility has a high influence: important aspects of this are both the proximity of the metro station and the advantageous location within the street network.
The differences at the micro-level are great: they hardly translate into the inaccessibility of high-quality groceries, but clearly affect their ease of access.

Quality of life: analysis
The maps above are great at demonstrating the whole landscape of estimated quality of life, but they cannot let us know what the real city-wide outliers are. In order to learn that, we have to use statistical analysis (Moran’s I), that will help us to search for clusters with high (red) and low ratings (blue). Results can be explored online (link).

On a city-wide scale, such analysis makes it possible to very convincingly find areas with low ratings that correspond to less affluent areas based on expert judgment. However, the picture we get is drawn in very broad strokes and lacks important spatial nuance.

Analysis on a finer scale allows ascertaining both positive and negative outliers with higher precision. Several positive outliers stand out, indicating newer residential areas with good accessibility by both public transportation and car. Negative outliers share some common traits as well: these tend to be relatively remote locations with poorer accessibility. However, this does not tell the whole story. A number of areas with worse groceries are situated in the middle part of the city and that fact can possibly be attributed to a combination of poorer housing conditions and some accessibility issues.
Quality of life: analysis method
Below one can see the way statistical analysis applied in this case works. The X-axis shows the normalized rating values of an individual store, and the Y-axis shows the average rating of stores located within a radius of 500 m.

Most residents have a decent grocery nearby, but about 10% of the population is served by stores with ratings well below average, within a distribution that is close to statistically normal.

Previous research steps demonstrate the compactness of housing clusters with poor grocery ratings, which may indicate areas that have lower quality of life .
The project aimed to test how well grocery stores can play a role in serving as indicators of quality of life. The original hypothesis was that there would be more bad and / or public rather than chain stores more in “poorer” areas than in more “wealthy” ones. The study showed that the situation is somewhat more complicated and we plan to take this into account in the next steps of our investigation.
Several steps are needed to further investigate using ratings of groceries and other destinations as indicators of quality of life:
- More attention needs to be paid to rating distribution within the same grocery chain, as well as store chain “ranges” and rating classes, as related to ownership, be it public, chain or independent.
- Shops at gas stations and supermarkets should be exempt from the research. They are extraterritorial and / or determine the quality of the environment themselves rather than are themselves determined by it.
- Сorrelates of the chain store ratings and types spatial distribution need to be determined: transport accessibility, building age, and other possible indicators.
A project by: Eugene Kalinouski (link), Dzmitry Bibikau (link)