During this lab, I used Datawrapper to create four different graphs. This lab showed how different data sets are complimented best by different graphs.
Graph 1: Line Chart
On TikTok, many users create videos joking about downloading TikTok before most other people did or before it was a popular thing to do. As someone who downloaded TikTok around October 2019, I was curious to see how many people have downloaded TikTok at different points in…
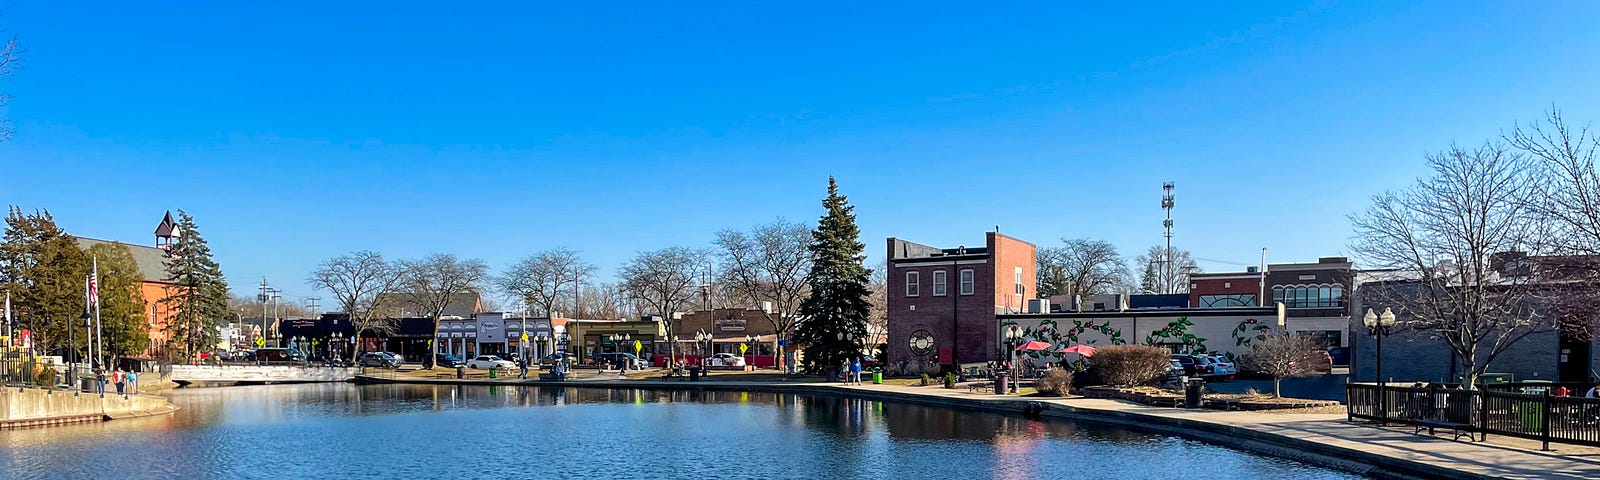
When we were younger, my brothers and I would go to Downtown Brighton with our parents every weekend. Today, we…
Soulshine is all about discovering what makes your soul shine — and how to balance this passion with the many commitments that high-achieving young adults have.
This podcast will offer stories and strategies from my personal life, as well as interviews…
Close-up Photo: