Understanding ConvNets (CNN)
The Portuguese version of this article is available in Entendendo Redes Convolucionais (CNNs)
Image recognition is a classic classification problem and Convolutional Neural Networks have shown a high accuracy history when it comes to the classification problem. The first successful application with a CNN was developed by Yann LeCun in 1998, with seven layers including convolutions and fully connected nets. Since then, CNNs have become increasingly deeper and complex, like AlexNet in 2002. Despite having only 8 layers, 5 convolutions and 3 fully connected layers, it has 60 million parameters. GoogLeNet (2014) has 22 layers and 4 million parameters.

Before understanding how a Convolutional Network works, it’s interesting to know what was the biological inspiration for this architecture. In 1962, Hubel and Wiesel did an experiment showing a few neurons being activate when exposed for some lines or curves and together could produce the visual recognition.
This is basically the principal Convolutional Network idea: to filter lines, curves and edges, and in each additional layer transform this filter into a more complex image. Let’s understand it with more details:
Inputs
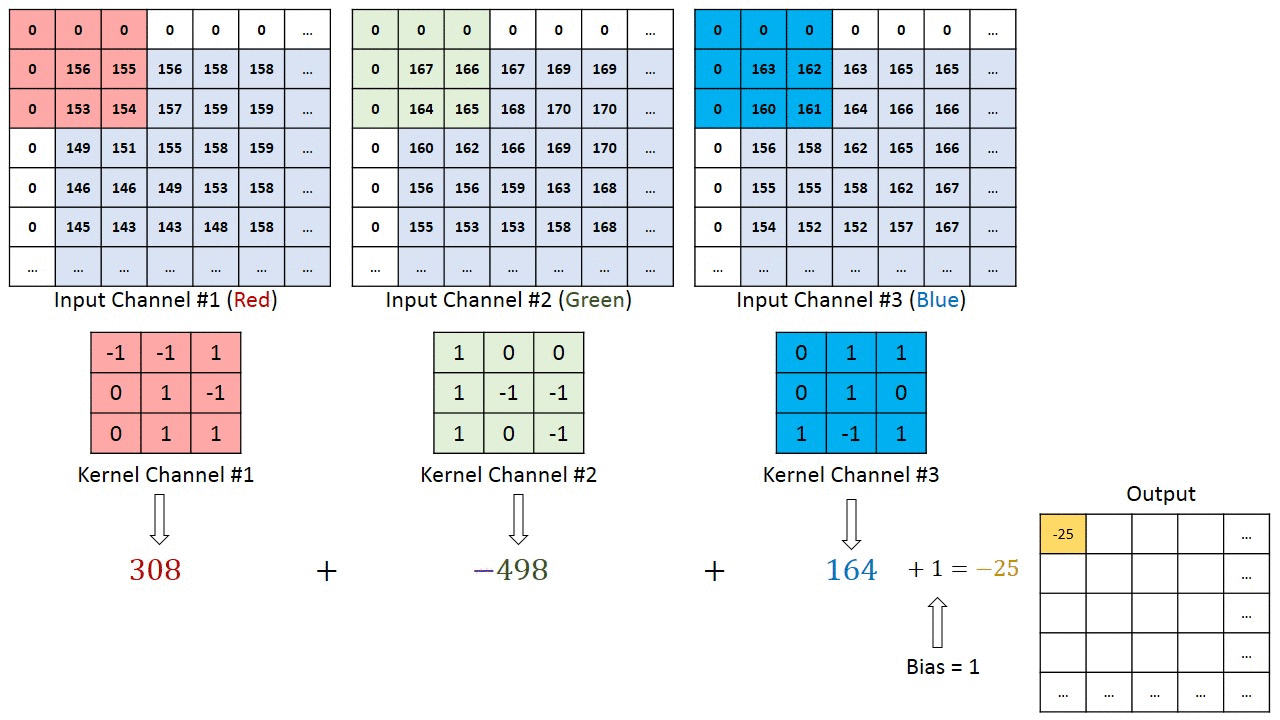
When we talk about image recognition/classification, the inputs, usually, are tridimensional matrices with height and width, according to the image dimensions, and depth, determined by the amount of color channels. Usually the images use three channels, RGB, with pixel values.

Convolutions
The convolutions works like filters that see tiny squares and slide through the whole image and capturing the most striking features. Explaining better, with a 32x32x3 image and a filter that covers a 5x5 image area and two step motion (called stride) , the filter will pass through the entire image, in each one of the channels, creating at the end a 28x28x1 feature map or activation map.

The convolution output depth is equal to the quantity of applied filters. The deeper the convolutional layers, the more detailed are the features identified by the activation map.
The filter, also called kernel, is formed by weights randomly initialized, updated by each new input through backpropagation. The tiny input region where the filter is applied to is called receptive field. For example, here there is a filter that represents the curve beside it.

At the image below the receptive field that will be multiplied by the filter is highlighted.

With this combination we have a high number as result, indicating a compatibility between the curves. When the image is not compatible this result is close to zero.

In addition to the filter size and the convolution stride as a hiperparameter, who is modeling a CNN also have to choose how the padding will be. The padding can be non-existent, where the convolution output mantains the original size, or zero pad, where a border is added and filled with zeros. The padding purpose is to prevent the layers from decreasing faster than the necessary for the learning.
Activation function
The activation functions are for bringing nonlinearity to the system, so the network can learn any functionality. There are many functions, like sigmoid, tanh and softmax, but the most indicated for convolutional network is the Relu, for being more computationally efficient without big differences in accuracy when compared to other functions. This function turns into 0 all negative output values from previous layer.
Pooling
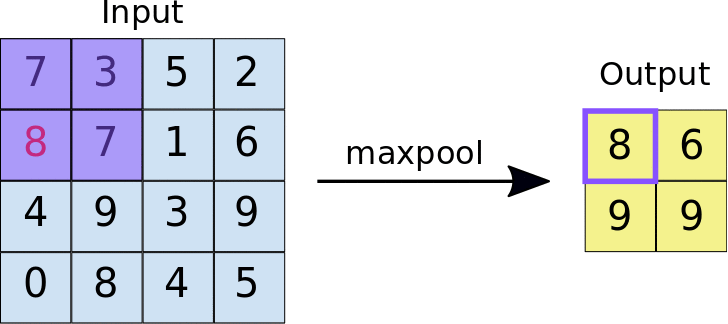
A Polling layer is for simplifying the information from the previous layer. This way, like in a convolution, one area unit is chosen, for example, 2x2 to move through the whole previous layer’s output. The unit is responsible for summing up the information from this area to a unique value. If the output of previous layer was 24x24, the poling output will be 12x12. Besides, it’s necessary to choose how the summarization will be done. The most used method is maxpooling, where only the biggest value is passed to the output. This data summarization purpose is to decrease the number of weights to learn and also to avoid overfitting.
Fully connected
A fully connected layer is put at the end of the network, where its input is the output from the previous layer and its output are N neurons, with N being the quantity of classes from the model to finalize the classification.
Practice time!
Below I show a simple example code for building a model using CNNs. In this code I utilize Tensorflow, a machine learning framework, with Keras, a high level API for neural networks. At this example I use the Cifar-10 dataset with 60.000 images with 32x32x3 dimensions and ten classes.
import matplotlib.pyplot as plt
import numpy as np
import tensorflow as tf
from keras.models import Sequential
from keras.layers import Dense
from keras.layers import Flatten
from keras.layers import Dropout
from keras.optimizers import SGD
from keras.layers.convolutional import Conv2D
from keras.layers.convolutional import MaxPooling2D
from keras.utils import np_utils
# Loading the CIFAR-10 datasets
from keras.datasets import cifar10batch_size = 32
n_classes = 10
epochs = 40(x_train, y_train), (x_test, y_test) = cifar10.load_data()height = x_train.shape[1]
width = x_train.shape[2]# Validation dataset splitting
x_val = x_train[:5000,:,:,:]
y_val = y_train[:5000]
x_train = x_train[5000:,:,:,:]
y_train = y_train[5000:]print('Training dataset: ', x_train.shape, y_train.shape)
print('Validation dataset: ', x_val.shape, y_val.shape)
print('Test dataset: ', x_test.shape, y_test.shape)
Training dataset: (45000, 32, 32, 3) (45000, 1)
Validation dataset: (5000, 32, 32, 3) (5000, 1)
Test dataset: (10000, 32, 32, 3) (10000, 1)
# Printing some images
cols=2
fig = plt.figure()
print('training:')
for i in range(5):
    a = fig.add_subplot(cols, np.ceil(n_classes/float(cols)), i + 1)
    img_num = np.random.randint(x_train.shape[0])
    image = x_train[i]
    id = y_train[i]
    plt.imshow(image)
    a.set_title(label_names[id[0]])
fig.set_size_inches(8,8)
plt.show()fig = plt.figure()
print('validation:')
for i in range(5):
    a = fig.add_subplot(cols, np.ceil(n_classes/float(cols)), i + 1)
    img_num = np.random.randint(x_train.shape[0])
    image = x_val[i]
    id = y_val[i]
    plt.imshow(image)
    a.set_title(label_names[id[0]])
fig.set_size_inches(8,8)
plt.show()fig = plt.figure()
print('test:')
for i in range(5):
    a = fig.add_subplot(cols, np.ceil(n_classes/float(cols)), i + 1)
    img_num = np.random.randint(x_train.shape[0])
    image = x_test[i]
    id = y_test[i]
    plt.imshow(image)
    a.set_title(label_names[id[0]])
fig.set_size_inches(8,8)
plt.show()

# Convert labels to categorical
y_train = np_utils.to_categorical(y_train, n_classes)
y_val = np_utils.to_categorical(y_val, n_classes)
y_test = np_utils.to_categorical(y_test, n_classes)# Datasets pre-processing
x_train = x_train.astype('float32')
x_val = x_val.astype('float32')
x_test = x_test.astype('float32')
x_train /= 255
x_val /= 255
x_test /= 255
This model has five convolutional layers and two fully connected layers. The optimizer used here is the Stochastic gradient descent with learning rate 0.01.
def create_model():
  model = Sequential()
  model.add(Conv2D(filters=128, kernel_size=(3, 3), input_shape=(height, width, 3), strides=1, padding='same', activation='relu'))
  model.add(MaxPooling2D(pool_size=(2,2)))
  model.add(Conv2D(filters=128, kernel_size=(3, 3), strides=1, activation='relu'))
  model.add(MaxPooling2D(pool_size=(2,2)))
  model.add(Dropout(0.25))
  model.add(Conv2D(filters=64, kernel_size=(2, 2), strides=1, activation='relu'))
  model.add(MaxPooling2D(pool_size=(1,1)))
  model.add(Conv2D(filters=32, kernel_size=(2, 2), strides=1, activation='relu'))
  model.add(MaxPooling2D(pool_size=(1,1)))
  model.add(Conv2D(filters=32, kernel_size=(2, 2), strides=1, activation='relu'))
  model.add(MaxPooling2D(pool_size=(1,1)))
  model.add(Dropout(0.25))
  model.add(Flatten())
  model.add(Dense(64, activation='relu'))
  model.add(Dense(n_classes, activation='softmax'))
  return modeldef optimizer():
    return SGD(lr=1e-2)model = create_model()
model.compile(optimizer=optimizer(),
              loss='categorical_crossentropy',
              metrics=['accuracy']
              )
model.fit(x_train, y_train, batch_size=batch_size, epochs=epochs, validation_data=(x_val,y_val),verbose=1)
model.summary()
The summary() command shows some informations about the model layers. We can see the dimensions of each layer and the learned parameters in each phase:

scores = model.evaluate(x_test, y_test, verbose=0)
print("Accuracy: %.2f%%" % (scores[1]*100), "| Loss: %.5f" % (scores[0]))
The result of this model is:
Accuracy: 75.24% | Loss: 0.71711
Although the accuracy of this model for this dataset is only 75%, through the use of more complex CNNs the accuracy achieved on Cifar-10 can reach 95%. This link shows the networks which has results with most high accuracy on Cifar-10.
I’ll leave here some links of references used by me to write this article, from which I also took some images. I recommend the reading them all (;
— Stanford CS class CS231n: Convolutional Neural Networks for Visual Recognition : http://cs231n.github.io/
— A Beginner’s Guide To Understanding Convolutional Neural Networks: https://adeshpande3.github.io/adeshpande3.github.io/A-Beginner%27s-Guide-To-Understanding-Convolutional-Neural-Networks/
— Neural Networks and Deep Learning Book: http://neuralnetworksanddeeplearning.com/chap6.html
— Machine Learning Guru Blog: http://machinelearninguru.com/computer_vision/basics/convolution/convolution_layer.html