Quantifying Our Museum’s Social Impact
How the Oakland Museum of California is using data science to measure impact.

Dear Reader,
I had planned to publish this article about the Oakland Museum of California’s social impact back in March but everything came to a halt with Covid-19. The Museum closed to the public and we began working off-site on March 13. Since then, we’ve been serving our visitors online via OMCA at Home and figuring out ways to help our community. We are researching, planning, and getting ready to welcome the public back to the Museum when it’s safe to do so. We are also contemplating how to foster and measure social cohesion in a time of social distancing. Our plan is to build on what we’ve learned so far about the Museum’s social impact and find new ways to continue the work. We are forging ahead and want to thank you for continuing on this journey with us.
Take good care, Johanna
The Oakland Museum of California (OMCA) is having a positive social impact in the lives of our visitors. We finally have the data to make that claim confidently. And we have the data that tells us we’re falling short of that goal for our visitors of color and low-income visitors. We know these things not because of vague intuitions or gut instinct, but because we’ve collected and analyzed the data.
This story is about how we did it and what we’ve discovered. If you’re just now joining us on this journey, take a quick peek back to our first story about how OMCA came to terms with community engagement as a strategy to achieve impact (rather than an end goal itself) and our second story about the process we used to define “greater social cohesion” as the specific measure of social impact that we’re trying to achieve.
Measurement of our social impact came only after several years of collecting core data on demographics and visitor satisfaction, as well as qualitative data on our programming. We couldn’t have developed our theory of change around social cohesion without years of investing in our community engagement work. We were only able to undertake social impact measurement because:
- We knew we had a diverse audience, with more than 50% people of color, a large audience of millennials and families, and a fairly broad range of income levels. Increasing social cohesion as a measure of impact really only makes sense if the underlying population of visitors (and your community) aren’t already bonded by shared ethnicity, income, age, etc.
- We had developed specific criteria for our exhibitions and programs that are intended to foster a sense of belonging, lift up untold or under-recognized stories, and create connections between people. We were already hearing in our qualitative studies that our visitors perceived OMCA as a community gathering place.
- We had worked to create a culture of data-sharing and data-informed decision-making before this effort. We have an established practice of hearing the good news and the bad news, and acting on our learnings.
Our framework for analyzing the data
We set out to try to answer four basic questions:
- What degree of impact are we having along each of our dimensions of social impact?
- For whom are we having the strongest, and the weakest, impact?
- Which variables (about the visitor and about their time at OMCA) contribute to a higher, and lower, overall social impact score?
- How are our social impact scores changing over time as we make changes to OMCA and our exhibitions and programming changes?
The depth and precision with which we’re able to answer those four questions using this new data is what we’re so excited about. We can slice and dice the data in so many more ways to find those bright spots and problem areas and see much more quickly where potential solutions to the issues might be, whether that should be changes to the topics we cover in exhibits, to the training our frontline staff receive, to how we structure events around the Museum, and so on.
In order to answer those four research questions, we use data science techniques to collect and analyze the data.

Step 1: Ask questions
 FFor the past 6 years, we’ve been conducting visitor exit surveys on a routine basis as part of our audience research practice. We decided early on in the social impact measurement process that these social impact related questions would get folded into our existing survey protocol. That routine survey is conducted with a random sample of visitors as they exit the museum at least 12 days of every month of the year.With that degree of data capture, we know that we collect a representative sample of visitors quarterly (i.e. we can show trends in the data quarter-by-quarter).
In July of 2018, we added about 2 minutes of time (onto what was already a snappy 2.5 minute exit survey) to include OMCA’s social impact scales. With these nine scales, we ask visitors to evaluate their experience of OMCA (and visitors’ ratings are how we evaluate the social impact OMCA is having on visitors). The scales were inspired by background research in social cohesion and social impact as well as qualitative interviews with our own visitors.

Minimizing bias in the collection process
We’ve carefully constructed the survey and our data collection process to minimize any potential biases or errors in the data. There are (at least!) five different steps we’ve taken to make sure we have the highest quality data to analyze.
- We invest in training so that anyone who’s going to be collecting data at OMCA is following the same protocol (e.g., where to stand, how to intercept visitors) and asking the questions using the exact wording in the survey.
- We’ve also ensured in our recruiting process that the data collectors themselves are as diverse as our community, minimizing the chance that any particular type of respondent feels uncomfortable sharing their honest feedback with an interviewer.
- We follow a random sampling protocol and survey 400 visitors each quarter. We intercept visitors at different times of day, days of the week, exit points of the Museum, and following different programs or events. This helps ensure we’re really hearing from a representative sample of all types of visitors.
- Although we ask nine questions, we actually only use the answers to eight of them in our overall scoring of social impact. Our “calibration question” in the survey is something that almost everyone says they agree with: “I like learning something new.” We use this scale as a reality check for the other responses. It’s also worth noting that all of the social impact scales are randomized in the survey platform, to ensure that the order in which visitors see the scales does not influence their responses.
- Similarly, two of our questions have a negative framing to them, helping respondents to think about their answers to every question for a split second longer and minimizing the chances that they choose “highly agree” across the board for all questions. The negatively framed questions also help us test the internal consistency of the scales.
Of course, even after we’ve taken all of these steps, it’s still possible for bias to creep into our data. It’s a little meta, but we also evaluate the evaluation process! On a regular basis, I meet with our data collectors to see if they’ve identified any ways to improve the process, and I’m constantly on the lookout to find new approaches that we could incorporate into our methodology to make sure that we end up with a data set that is truly measuring the attitudes and perceptions of our visitors.
Iterating on our process
The new social impact section of the exit survey launched in July 2019 and we spent the next three months essentially testing it in the field, with the expectation that changes would be made to the survey instrument based on how visitors were actually responding.
Early on, we made a technical change to the survey instrument, changing from 7-point to a 5-point scales (e.g. strongly disagree, disagree, neutral, agree, strongly agree). We found that the 7-point scale was too cumbersome to administer and respondents did not need that many “shades of gray” in the scales.
We iterated different phrasings for the scales. I won’t go through all the versions we used, but testing the scales was an important part of our process and we are revisiting the scales as we collect more data.
Step 2: Analyze the data
 AAfter all of that careful collection, I began analyzing the data. Some interesting trends were emerging from the frequencies and crosstabs, but I wanted another set of eyes on the data — someone who could provide additional analysis and an external perspective. I reached out to my colleague, Susan Blank from QuestResearch Group, who had recently conducted a market research study for us — who also happens to be a demographer (an expert who uses data and statistics to study large populations of people) — and we talked through the data to figure out the most useful statistics to run.
The analysis that we used is called “logistic regression.” In this type of analysis, visitors are placed in a “high scoring” or “low scoring” group based on how they responded across all eight of our dimensions of social impact (e.g. their total score incorporates their scores across all eight dimensions). Then we can figure out which variables (which are aspects of a visitor’s demographic profile or something about their experience at OMCA) were associated with the “high scoring” or “low scoring” group.
We chose logistic regression analysis for a number of reasons. After the initial data analysis, we found that visitors’ responses clustered towards the higher end of the scales, so we couldn’t use average ratings. We discussed different ways to deal with this distribution and landed on a coding system that designated visitors as having low agreement (ratings of 1–4) which we called “low scoring” or having high agreement (rating of 5) AKA “high scoring.” We used this strict interpretation of impact so that we could more easily uncover nuances in the data. Furthermore, by focusing on anyone who didn’t choose 5, we can better identify areas of improvement.
Logistic regression analysis is also useful for figuring out exactly which variable made the biggest difference to a visitor’s overall score, particularly when some variables tend to be correlated with each other. For example, it’s common for visitors at OMCA with a child to fall within a fairly narrow age range; for those types of visitors, was their social impact score related more to their age or more to their having a child with them during their visit?
After all of this analysis, we ended up with three different data tables (corresponding to our first three research questions), with one more table on the way (once we have more data over time) in response to our fourth research question.
Now onto the juicy bits about what we actually learned from the data!
Answering: Along which dimensions are we having an impact?
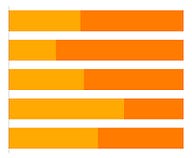
First, we have the percentage of visitors who indicated they “strongly agreed” with each of our eight indicators of social cohesion (plus the one “calibration” question that isn’t included in the total score). At the highest level, this table tells us that across all of our visitors we’re doing a pretty good job at helping visitors appreciate that OMCA tells stories from different communities, but there’s still at least 40% of our audience for whom we could be doing a better job at that. On the other end of the spectrum, we have the most room for improvement in making sure visitors see their own experiences and identities reflected in OMCA’s exhibits, since only 34% strongly agreed with this statement.

That high-level data from each of our eight dimensions of social impact is already a huge step forward from what we capture about general positive/negative perceptions of OMCA via our Net Promoter Score.
Steps 3+4: Sorting total scores into groups and predicting who fits into each group
The next level deeper insights that we can glean from this analysis is about who is being impacted by their visit to the museum, based on their total score.
Answering: For whom are we having an impact?
 DDon’t worry too much about trying to interpret the numbers in this next table, the important takeaway is that if the Exp(B) column is on the high side (1.4+), that means that this particular quality of a visitor or their experience is highly predictive of them also having a high total social impact score. If the Exp(B) column is on the low side (under 0.7), then this particular quality of a visitor or their experience is highly predictive of them also having a low total social impact score.
 FBasically, the closer that Exp(B) is equal to 1, the less predictive that quality is at determining a high or low social impact score, and in the case of all 13 variables, the regression model controls for confounding variables. The Sig. column value also needs to be low (0.05 or less) for us to consider the Exp(B) data as being meaningful and not due to random chance.
You can see in the table below where the following types of visitors tend to score high for total social impact in our model:
- OMCA Members
- Females
- Visitors attending Friday Nights @ OMCA programming
Conversely, the following types of visitors tend to score low for total social impact in our model:
- Low-income (those with an annual household income of less than $50,000)
- People of color
Honestly, we expected to see lower scores from those two types of visitors based on our prior audience research and evaluation methods as well as what we know about museums and historically underserved audiences. Seeing those results in the analysis reassures us that the scales are working and that visitors are being honest with us. If the data analysis showed that all of our visitor types scored high across the board on all of our measures, then I would have questioned our survey tool, methodology, and analysis. In fact, the value of logistic regression analysis is that it allows you to test different variables while controlling for all other factors. So, for example, among women, low income visitors score lower; and among men, low income visitors score lower. The result can’t be explained away by another characteristic or factor — other than income. We intentionally designed the study to help us identify areas of improvement and that’s how we are using the data.

Step 5: Score each question across each segment
But wait! Our data lets us go still one level deeper to understand how each type of visitor scored on each of our eight dimensions of social impact.
Answering: Where specifically do we need to focus our attention?
 YYou can read the table below just like the earlier one — the higher the Exp(B) datapoint (particularly those over 1.4), the more predictive this quality of a visitor or their experience is of being in “strong agreement” with that particular social impact dimension; the lower the Exp(B) datapoint (particularly those under 0.7), the more predictive this quality of a visitor or their experience is of not being in “strong agreement” with that particular social impact dimension.
We’ve learned so many valuable insights from this deepest level of analysis.

Attending Friday Nights @ OMCA is highly predictive of visitors strongly agreeing that they enjoy being around new people at OMCA and that they enjoy having conversations at OMCA. This has been our gut-feeling since the early days of Friday Night programming, but now we have the actual data to back that up and it’s helping us make the case to funders. So now our question becomes how can we extend what happens at Friday Nights to other types of programming we do across the venue?
While persons of color who attend OMCA are less likely to feel welcome and that OMCA is for someone like them than are higher income visitors, it’s not because they feel their experiences and identity are missing in OMCA’s offerings, nor because they perceive a lack of diversity represented in the stories told at OMCA. Instead, they’re less likely to be engaging with family and friends at OMCA and less likely to enjoy meeting new people at OMCA. They are less likely than other visitors to feel they can express their ideas at OMCA. So now our question becomes what are the barriers or obstacles we’ve put in place that inhibit conversation, meeting new people, and expressing ideas for persons of color (and how do we dismantle those)?
Similarly, those visitors from lower-income households are less likely than wealthier visitors to feel welcome at OMCA. They are less likely to see OMCA as telling stories from different communities, and they are less comfortable expressing their ideas at OMCA. We know that we’re trying to undo many years of museums (and many other institutions) being exclusionary to those audiences. OMCA is trying to be a different kind of museum, but it will take even more work on our part. We are particularly grateful for the clarity these social impact indicators provide on the experience of our low-income visitors. Before our journey into social impact measurement, we would see low-income audiences score relatively highly on a Net Promoter Score, even though we had an intuitive sense that there was more we could do to improve their experience. Now we know in much greater detail how they feel about their experience. So now our question becomes how can we better incorporate the stories of these visitors at OMCA and help them feel more comfortable sharing their ideas?
Membership also seems to have the ability to drive higher social impact, but it’s not clear from our analysis if membership, per se, drives social impact, or if visitors become members when they feel socially connected to OMCA. And we can see that being a member is the only variable that leads to an increased likelihood of feeling that OMCA is a place for “people like me.” So now our question becomes how might we design an experiment or additional data analysis that would help us determine the directionality of this relationship between membership and social impact?
We can see in the data that women have stronger agreement across the board with all of our social impact indicators. Market research often shows women to be more agreeable when asked survey questions, but our experienced demographer said we shouldn’t discount the finding given how strong of a correlation we see; instead it’s something for us to own proudly. So now our question becomes do other genders need something fundamentally different from their experience at OMCA than women in order for their experience to have a positive social impact on their life?
There are a handful of audiences for whom we have only one or two notable areas of improvement across all eight of our social impact indicators. Visiting with a child is associated with a decreased likelihood of feeling welcome at OMCA. Also, younger adults are less likely to feel welcome and that OMCA is for them. First time visitors have lower odds of feeling comfortable expressing their ideas at OMCA, and a lower likelihood of strongly agreeing that they enjoy having conversations at OMCA. This data analysis helps us prioritize where we need to invest the most resources and where can we make more subtle changes or put something on a longer term track for change. So now our question becomes will the changes we implement for persons of color and lower-income audiences also have a positive impact on those visiting with a child, or younger adults, or first time visitors?
Step 6: Measure over time
And, of course, our work measuring social impact will never be over.The next step in our data analysis process will be to examine how these social impact scores, in total and across each group, are changing over time as we make changes to the Museum.
Answering: How is impact changing over time?
We’re still in the process of collecting our “next round” of visitor data to analyze, so we can’t show any trend data yet.
But one issue we’re still trying to disentangle is how to account in our analysis for the differences among our temporary exhibition topics and the different types of audiences they tend to attract. Over the past year at OMCA, we’ve featured an exhibit on the innovative husband and wife duo Charles and Ray Eames, as well as the untold stories of California’s LGBTQ+ communities. These two exhibits had very different engagement goals and both attracted very different demographic profiles of visitors. These differences make it hard to see the “real” trends or patterns in quarter-over-quarter changes to our social impact indicators that are based on changes we’re making and not just based on exhibit-specific factors.
However, simply having these eight defined indicators of impact on hand is also helping our staff discuss the specific merits of upcoming exhibits and how we might focus on leaning into a particular indicator for a particular exhibit. Now we can plan interpretive opportunities and features of an exhibit around specific indicators like encouraging conversation, or for visitors to express their ideas, or ensure that they can see their identity reflected in the exhibit, no matter the preconceptions they might bring to an exhibit about chairmakers or queer people. We know that a single visit to OMCA is unlikely to have a transformative impact on visitors, but we believe that impact will be strengthened over time as the sum total of different complementary experiences.
Sharing the data
Now that we’ve collected and analyzed this first set of data, we’re beginning to share it more widely with our staff. In October we presented our analysis and findings to our Executive team. Throughout December, I conducted “meaning making” workshops with each of our Centers (aka Departments) to facilitate conversations about the data and what it means for each of our teams. And in the first quarter of 2020 during our annual planning period, we’re getting the opportunity to use this data to make course adjustments for the rest of the year and beyond. We’re also planning on mid-year and end-of-year summaries of new data as it rolls in, as well as incorporating some of the data into our monthly dashboard of visitor insights.

We’re excited to make changes at OMCA and see whether, and how, the social impact scores change, and for whom. We’re excited to see whether we can create (and measure) a self-reinforcing feedback loop: as more persons of color and low-income audiences feel more welcome, see their stories reflected, connect with other people, and feel comfortable expressing their ideas, does that increase attendance by similar audiences.
Finding your own measures of social impact
It’s taken years of research into the needs of the community of Oakland as well as deep reflection and long, sometimes difficult conversations, among my colleagues for OMCA to arrive at these eight measures of social impact (check out this article for more background on our process). We’ve been inspired by the interest and response from our colleagues across the museum field and the broader arts world around our process. We hope that your takeaway from learning more about our process is much more around approach and methodology and less around specific outcomes.
We don’t believe social cohesion is the “right” measure of social impact for all museums.
And even for those organizations who are attempting to increase social cohesion, we don’t believe that our indicators are the “right” way to measure impact at the individual or community level. We also want to make clear that OMCA isn’t staking any claims on the idea of “social cohesion.” We were inspired by research from the United Nations, but we’ve used their research as a jumping off point for our own thinking.
We do believe that cultural institutions often remind us of our shared humanity, foster empathy, and prompt contemplation and dialogue, among so many other benefits they have the capacity to bring at the individual and community level. If you are inspired by the idea that your organization might be increasing the social cohesion of your community, my hope is that you go beyond mere inspiration into rigorous measurement and even more important, use that data to make significant changes at your organization to improve the lives of your visitors.
If you want to dive even deeper into the cycle of social impact measurement, I would highly recommend Randi Korn’s book, Intentional Practice for Museums. She makes a great argument that you not only have to articulate your impact, but also do the hard work to examine whether your work is aligned with your impact. It’s tempting to jump to claiming impact without undertaking every part of the cycle first: planning for impact (understanding your visitors, ecosystem, institution, board, and staff and then defining impact in measurable terms), evaluating (designing evaluation methods and collecting data), reflecting (discussing and learning from the data), and aligning (changing activities in response to the data).
Here’s the real deal: this is hard. Understanding the needs of your community and what unique capacity your organization has to meet those needs is a huge ask. Collecting data that accurately measures the true impact your organization is having in a community is something the social development field has been trying to figure out for decades. The business community has invested trillions of dollars trying to better understand how to shift institutional practices to align with and respond to incoming data. Nobody’s completely figured it out. But we’re in it for the long haul and we hope you are too.
It can be a long journey, but you can start just about anywhere. Our Executive Director and CEO Lori Fogarty is up next with a deep dive into how our measurement of social impact is changing OMCA, a few of the challenges we’re still wrestling with, and a bit of advice for what she thinks you need to keep in mind throughout the process.

This story is part of a publication on Medium exploring how arts organizations are adapting to reflect the changing demographics of California, engaging with their communities, and becoming more resilient organizations as part of the New California Arts Fund at The James Irvine Foundation.