On Being A Spatial Data Archaeologist
Tim Wallace, a self-described cartographer and visual storyteller, draws inspiration from telling stories and mapping things that no one has seen before
After beginning his career studying archaeology and geography, Tim Wallace specialized in maritime archaeology before pursuing a PhD at the University of Wisconsin-Madison. He spent over six years working as a geographer and graphics editor for The New York Times, before leaving to work as a visual journalist and geographer for Descartes Labs.
I had the pleasure of picking Tim’s brain and pressing him on his artistic process, the weight of responsibility, and the dreaded question of whether he prefers print or digital.
Tools and the Data Visualization Process
CH: What’s your process for starting a project? Simulated data, sketches, what do you focus on?
TW: This started when I lived in New York — I would spend at least two hours a day on the subway, and as my mind would amble I got in the habit of passively thinking about different things that could be interesting to map. So I get my idea and wonder if the dataset even exists, and poke around to see how I’d build that thing.
Another way I approach projects, especially now that I work at a company where the bread and butter is bespoke interesting data sets, is to take a stab at visualizing whatever it is really quickly. I’ll try 10 different ways or 20 different ways and if I come up empty then I go back to pondering, and if I don’t come up empty, then I get to the sketching part.

CH: Technology evolves quickly — how do you stay on top of modern mapping/geography tools?
TW: This is one thing I loved about the graphics desk at the Times: Everyone used whatever tool that they were most comfortable with because when you’re on deadline, you just have to do something quickly. And if you’re lucky, you might have a little time to teach yourself a new trick or two.
In terms of tools, working at Descartes is making my life easy, to the point where I’m not learning as much because we have an engineering team that streamlines everything to get jobs done quickly. The APIs improve, and the tools get faster and better and easier, so you have to develop fewer workarounds. We have a data ingest team too, that handles things like super-arcane government data sets that are in a format that only exists because this one person determines that they publish their data in that form.
CH: The dreaded PDF data table!
TW: Yes, that’s the one! So we have a whole team that ingests and harmonizes everything, so everything is within arm’s reach and you can analyze whatever you want. You can look at satellite data or you can compare weather data from the 1970s to now. I still have nightmares about nested NetCDF files, and how when you finally get deep into it, you realize the thing that you wanted isn’t even there and like half a day has passed.
I do feel like it’s hard to keep up with tools, and we live in a time when visualization techniques are rapidly progressing as well. People will do some kind of wacky experiments, and sometimes for that field or industry the failures are weirdly more helpful than successes because you learn from it. That’s why it’s hard to keep up with the field — so many people are doing interesting stuff. It’s like constantly walking up a steep hill but it’s really fun work.
CH: Here’s an easy question. Do you prefer print or digital?
TW: Oh boy. Yeah, that’s not an easy question. I think as an absorber of culture, as someone who likes to feel the warm glow of old beauty or something like that, I really enjoy paper maps.
When I first got to Descartes Labs, I argued with some people about this. We could each take the highest resolution screen that you can get and the DPI still isn’t going to come anywhere close to where you can get with a professionally-printed map. You might get a billion colors or whatever, but you’re not going to get that fidelity.
With digital or internet maps, though, it’s easy to quickly try out different ideas, and obviously interaction on the web is infinitely more rich than you can make it in paper. You can put some goggles on now and stand in a map — it’s maybe not as practical as it could be, but as a state of interaction it’s far more versatile than a piece of paper. For super complicated things where you need several steps of explanation, I think the web makes it easier.
So, I’m on both sides. But secretly in my sleep, in between snores, I’d probably say “Priiint!”

The Responsibility of Being a Cartographer
CH: Looking at some of the work you did related to Hurricane Harvey, and going back to the idea you mentioned of explaining things people haven’t ever seen, does cartography come with some sort of responsibility?
TW: I have a different responsibility now that I work for a private company. At the end of your project the responsibility is to be as clear and honest as possible about what information you actually have. That’s not easy. When you first want to make a map, of course, you want to blow it out and make it the most beautiful thing ever, and put all the colors and all the data in there and call it reality. A boring, tired idiom at this point, right? All maps are lies, but not all of them are malicious or negligent.
At the Times, everything that I created had several eyes on it to make sure that every aspect of it was being true to the story and as fair to the readers as possible. And we fail sometimes. There was one map in particular that many of us on the graphics desk were arguing against making, but our editors won out and it went on the front page. The result was a number of corrections that we had to make because, it turned out, our readers had the same concerns that some of the graphics editors had. When you mess up like that, if you have an understanding audience that calls you out, you know not to do that next time.
Now, I work with scientists who like to come up with their hypotheses and do their analysis, and then try to find ground truth to try to do some kind of error matrix and write a couple of publications. Then to see what their peers think they go to a conference or two, and then they decide whether they can say it’s true or not.
But I come from journalism where if you’re pretty sure about something, it’s okay to say you’re pretty sure and then list all of the caveats.
So, part of my job here is to help people communicate very complicated work in a way that is both understandable to people who would be interested in it but still something the scientists are comfortable saying. They’ve done a lot of work on this, it’s their analysis, and they should be happy with the way that it’s being presented. So my responsibility now is to the author of the analysis and to the people who will be consuming it.

CH: Following that, after reading your thread on Twitter about the possibility of oil slicks near the Bahamas after Hurricane Dorian, I wanted to ask you — with mapping, how do you handle what’s noise and what’s not?
TW: Own up to what you don’t know. Part of why I tweeted that was because Jeremy, who I work with at Descartes, saw the images and he asked people internally what the heck could this be. A couple of us did some simple remote sensing indices to try to figure it out and we didn’t know. So I was wondering, is this an oil slick? Then this guy on Twitter replies, and after quite a lot of back and forth he thought it was sargassum or seaweed or something. I love it!
I actually did a piece with Sarah Almukthar called The Battle for Mosul in One Image. This was such an interesting piece to work on — we had this satellite data with both visible imagery and near-infrared to detect heat, but we also had reporters on the ground on the eastern edge of the battle line. They were able to confirm the fires that we were seeing were being caused by specific things on the ground. So that’s a very organizational, newsroom, kind of thing you can do. On social media you can do it too, if you trust the people you’re interacting with. Whether it’s a fire or an oil slick, you can call out to people who might might be there.
Ultimately this is both the journalist’s answer and from a cartographer who’s taken any critical cartography class. You just have to be honest about what you know or don’t know, and be careful not to be too evocative or insensitive.

CH: Another thing from your Twitter feed: you are constantly tweeting amazing historical maps and advertisements: how did you find them? Do you have a treasure trove that you’re sitting on?
TW: When I was an undergrad, I volunteered with the Maryland state underwater archaeologist and one day, he took me to the Library of Congress map room. I feel like it changed my life in a day. I didn’t want to look away, I wanted to go back every day to get more inspiration and just keep learning more.
This is something said a lot about maps — as long as the Earth is revolving around the Sun, every map has not been made. Many old maps reveal so much about how our landscape and our cultures change and I just find it so fascinating.
But now, so much stuff is online that it made writing my PhD dissertation so much easier. I could just dig into the digital archives and find examples. One of the main threads of my dissertation is on how interactive maps were not invented with the internet. Newspapers and magazines were using interaction for decades, and I found some examples from like early 1900s that started with this blank map. And at the bottom, there’s a chart with congressional results from four years ago, with a challenge to guess the results for the coming election and send it back, with the closest guess winning a bucket of peaches.
During World War I and II, big maps were published that were meant to end up on your wall, and you would get instructions to use different colored pencils to follow the battle lines and so forth. I also have some old Fortune magazines where every other page has a map, but it wasn’t like a data graphic, it’s an ad for toothpaste or something. I wish someone would take that collection and do really interesting analysis on territory as power, as something that evokes psychology, which is why you should buy this product. It’s almost obvious to me what they’re doing with geography even though I haven’t done that research, but I would definitely read that article.

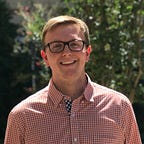
Building in America” project, by Tim Wallace, Derek Watkins, and John Schwartz
CH: I love the map of every building in the United States you did as a send-off from the Times. For such a big project, are there any surprises? Like you do the analysis and look at it full scale, and find something that’s not what you expected?
TW: That might be the number one thing I love about doing this work! The buildings map was loaded with surprises, like strange patterns in suburbs and being able to see the folds in the Appalachian mountains.
After looking at these maps for hours and hours, there were two types of interesting patterns. One was things that were forced on the environment, like these suburb patterns, and one was where the built environment had to yield to the physical environment and it shows. That project had a ton of stuff like that in it.
More recently with Descartes Labs, we did a blogpost called “Sharpening The Focus on Methane Emissions.” When you look at the data locally, you can find some pretty stark patterns. The Permian basin really pops out because of all of the venting and gas activity that’s happening there.
When you make a map, you pick the data and load it up, and you expect there should be something, but you don’t know what. This marshland in Wisconsin has one of the highest levels of methane over the last nine months. Just a natural thing, marsh gas. The fact that that pops out every bit as much as some of the industrial cattle ranches — I would not have expected that. But, if there are no surprises, there is no story.

Building in America” project, by Tim Wallace, Derek Watkins, and John Schwartz