Spidey SenseCrafting Compelling Visual Narratives: A Guide to Data Visualization and InfographicsIn today’s information-rich world, data visualization and infographics play a crucial role in making complex data accessible and engaging…1d ago
Rosamund PearceinThe EconomistWhy you sometimes need to break the rules in data vizBest practices help us to avoid common pitfalls in data visualisation — but we shouldn’t follow them blindlyFeb 28, 20208
Alden Do RosarioinBootcampGenerating infographics using ChatGPT and Dall-E 3Step-by-step guide on how you can create beautiful infographics using ChatGPT Plus and Dall-E 3.Oct 22, 202310Oct 22, 202310
AniketnayakIt’s better to have an empty mind rather than consumed mindDon’t worry I will explain it to you2d ago2d ago
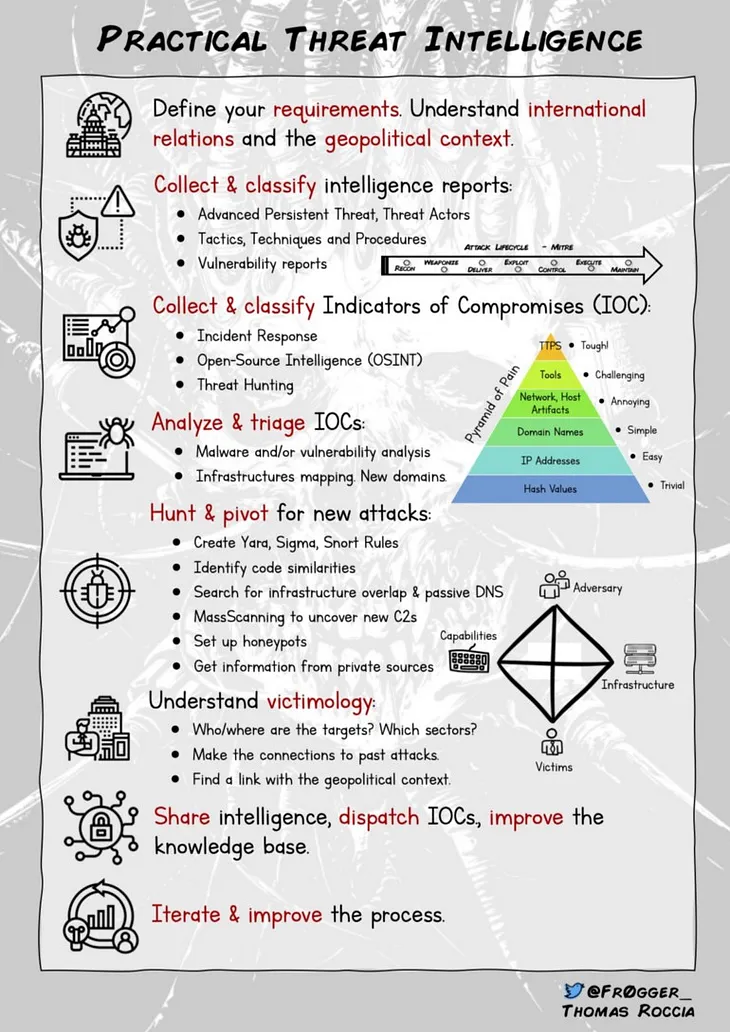
Thomas RocciainSecurityBreak6 Useful Infographics for Threat IntelligenceVisualizing Cybersecurity concepts can be a terrific way to learn more about specific tools, methodologies, and techniques! Here is a post…Dec 18, 20228Dec 18, 20228
Spidey SenseCrafting Compelling Visual Narratives: A Guide to Data Visualization and InfographicsIn today’s information-rich world, data visualization and infographics play a crucial role in making complex data accessible and engaging…1d ago
Rosamund PearceinThe EconomistWhy you sometimes need to break the rules in data vizBest practices help us to avoid common pitfalls in data visualisation — but we shouldn’t follow them blindlyFeb 28, 20208
Alden Do RosarioinBootcampGenerating infographics using ChatGPT and Dall-E 3Step-by-step guide on how you can create beautiful infographics using ChatGPT Plus and Dall-E 3.Oct 22, 202310
AniketnayakIt’s better to have an empty mind rather than consumed mindDon’t worry I will explain it to you2d ago
Thomas RocciainSecurityBreak6 Useful Infographics for Threat IntelligenceVisualizing Cybersecurity concepts can be a terrific way to learn more about specific tools, methodologies, and techniques! Here is a post…Dec 18, 20228
AnyChartinData Visualization WeeklyDataViz Weekly: Accuracy, Admissions, Demographics, ElectionsReady for a fresh dose of impressive data visualizations from real pros? Check out what DataViz Weekly has in store for you this time!Jul 12
Victor AkpanHow to Use ChatGPT + Bing AI to Create The Perfect Infographic For Your PresentationYou don’t even need design skills6d ago
Payman TaeiinTowards Data ScienceIs the Difference in Work Hours the Real Reason for the Gender Wage Gap? [Interactive Infographic]Every year, the Department of Labor issues a report on the pay gap between women and men.Jan 22, 20197


![Is the Difference in Work Hours the Real Reason for the Gender Wage Gap? [Interactive Infographic]](https://miro.medium.com/v2/resize:fit:730/format:webp/0*utqGbmHQYS9VVqpt.gif)