Database — Modeling : Entity Relationship Diagram (ERD) (Part 5)
A common approach to sketch the entities and their relationships.
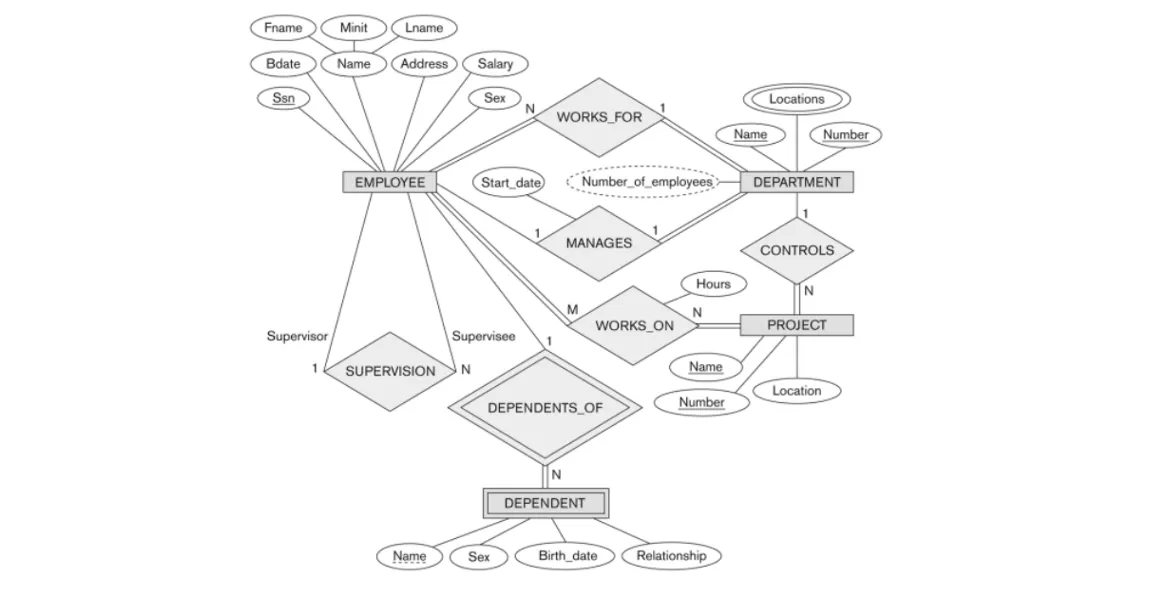
Let’s take an example of a company database
Wish you already came along the last part Database — Database Design: Conceptual Design (Part 4)
Entity Relationship Diagram
An entity relationship model, also called an entity-relationship (ER) diagram, is a graphical representation of entities (which will become your tables) and their relationships to each other.
Database modeling is the process of creating a data model.
Entity
A simple rectangular block represents a table.

Relationship
It’s sketched using the diamond shape.

You can sketch the type of the relationship, whether one-to-many using “1-M”, or many-to-many using “M-N”, or one-to-one using “1–1”.
The lines connecting an entity with a relationship whether single or double line refers to another constrain (we talked about earlier) called “Existence Dependency Constraint” (also called “Participation Constraint”).
So, for example, if an employee must work for a department, this is sketched by double lines, and called “total or mandatory participation”. And if an employee may or may not manage a department, this is sketched by a single line and called “partial or optional participation”.
A relationship itself can have attributes. In which table we will include these attributes will be discussed in Database Mapping in the next tutorial.
— Recursive Relationship
It’s a relationship with the same entity. For example, an employee may act as a supervisor for one or more employees, while an employee may be supervised by an employee (it’s a one-to-many relationship).

Weak Entity
A weak entity is simply an entity where its existence depends on another entity. You can’t logically have dependent(son, daughter, ..etc.) with the absence of the employee table. It’s sketched the same as a normal entity but with double lines.

— Partial Key
A weak entity has what’s called a “partial key”. It’s one or more attributes that uniquely identify a weak entity for a given owner entity. In our example, the dependent name is unique for every employee.
It’s sketched the same as a normal attribute, but, with a dashed underline.
It’s called partial because it can’t be a primary key on it’s own, it needs another column, which is the foreign key of the owner entity. This will be discussed in Database Mapping in the next tutorial.
— Weak Entity Relationship
Also whenever there is a relationship between a weak entity and another entity, it’s sketched the same as the one above, but with double lines.

Attribute
An attribute or a column (simple) represents a piece of data in the table, like an address, salary, and date.

Primary Key
It’s sketched the same as a normal attribute, but, with an underline.

Composite Attribute
A value that is composed of some other values, for example, you may have name that’s composed of ( first name, middle name, and last name).

We don’t define one column for name (if it’s composite), instead we split it up into simple separate columns; first name, last name. One reason is because you may do something different with the last name(or first name), and you want to get to it by itself. This will be discussed in Database Mapping in the next tutorial.
Multi-valued Attribute
Multiple values for a single column, for example, the locations of a department may have more than one value at the same time.

Multi-valued attributes will be extracted in another table. This will be discussed later in Database Mapping.
Derived Attribute
When you have a column where its value could be calculated from another column. Thus, there is no need to insert its value every time. For example, we can know the number of employees working in a specific department by counting the number of rows.

This will be done automatically by the DBMS, and it will lead to having consistent values rather than accidentally inserting a wrong value.
Symbols Summary
Here is a summary of all the symbols in the ERD.

Wrapping Up
Using the entity relationship diagram to sketch your database is a common way to visualize your tables, columns, and their relationship.
Now, It’s time to translate the entities, relationships, multi-valued attributes, into actual tables. Next is the “Logical Design (Data Model Mapping)”.
References: