Deep Dive Into Reddit Data
Two weeks ago (at the time of publishing), our team set out with a simple idea: to make a cool visualization of Reddit that would allow us to explore the relationships between different communities. Such visualizations have been done before of course, but only in a static manner that presents an overwhelming amount of information, our goal, above all, was to present the data in a manner that would be useful.
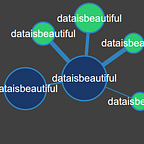
This is our product.
For those who are unfamiliar, Reddit is a social news aggregation site where you can comment and rate content submitted by users. Content is divided into topics or areas of interest called subreddits that Reddit users, Redditors, can subscribe to.
The Reddit Visualizer (RV) site pulls data from Reddit and visualizes connections between subreddits to an interactive graph. Each subreddit is represented by a sized and colored node. Node size indicates the relative subreddit subscriber count and colors codify whether a node is expandable, repeated, active, not safe for work (nsfw), or the currently selected node. Expanding a node shows the top related subreddits linked by lines — wider lines represent stronger connections and connections are determined by shared Redditor activity.
Specifically, for each subreddit we gathered the hottest fifty posts at the time data was gathered, and checked the last 100 comments of each redditor who made those posts. Each post made in another subreddit by that redditor counted as a single point towards that connection. It is also important to note that connections are directional — just because a small subreddit leads to a larger subreddit, does not mean that larger subreddit leads back to the smaller one.
Big data was a large driving force behind RV — it was built with a two major goals: visualize an aesthetic representation of real and meaningful relationships between subreddits and create an interactive and explorable graph. As of now, there are over 7,000 subreddits represented on the map, with well over 43,000 connections total (although not all connections are displayed).
Some Interesting Data
From looking at the visualization, some interesting trends emerge. For example, you can see here there’s a tight coupling between subreddits dedicated to Blizzard games, a behavior you’d expect to see:

There are also other interesting trends, like nsfw subreddit clustering. As you’d expect people don’t usually associate their nsfw purchasing/watching/commenting habits with their day to day life, or accounts that might be discovered by people in their lives, thus we see “clustering”, that is accounts that post to nsfw subreddits post to a *lot* of those subreddits, hinting at dedicated nsfw accounts.

There are also relationships you can’t see — negative connections you would expect but that aren’t there: MOBA (multiplayer online battle arena) subreddits seem to be decoupled. This seems counterintiuitive, given that you’d expect similar types of games to sort of cluster. This hints that MOBA players tend to focus on one specific game (a known phenomenon, mostly due to the amount of investment in time and potentially money most MOBAs require).

If you’re interested in the technical bits, keep reading, otherwise you may want to skip ahead to the bugs/bloopers near the bottom of the page.
The Process
We began by discussing the overall features of RV and fleshing out how we wanted each feature to work. This involved quite a few hours writing out user stories, putting them on Pivotal Tracker, and continuously tweaking everything as the application evolved. Scrumming every day (and making the most of our Agile workflow) was essential for the team to stay on the same page and keep all of our ducks in a row.

Beyond that, RV is deployed on Heroku — we deployed as often as we could, especially after features, to avoid any snafus.
The app is built on Ruby on Rails and PostgreSQL. We toyed with the idea of a NoSQL database and looked into MongoDB as well as the Mongoid gem to keep our data in a readily usable format for our front-end. We were concerned Heroku’s database size limitations would prevent our data gathering efforts from the Reddit API (which we later pulled out of our app into its own Ruby gem). Ultimately, we decided the data was straight-forward and malleable enough for our purposes so we went with Postgres.
The front end visualizations make heavy use of Data Driven Documents (D3) , a JavaScript library, particularly force layouts and quadtrees. AngularJS also makes an appearance for the site’s sidebar and searching functions.
Deep Dive: Data
Tackling the data gathering issue required the consideration of a number of problems, the first being: volume. In order to generate a significant visualization a minimum threshold of data had to be crossed. It’d be useless, for example, to design a visualization if we were only going to poll three subreddits, no matter how thoroughly we were going to see their connections to each other. It’d also be useless to only gather data on one user per subreddit, or other such silliness. Thus whatever solution we deployed, we had to be confident it could, in the span of a few days, or preferably hours, gather vast amounts of data.

There were really only two options insofar as data acquisition went, we could either scrape it manually, or interact with the Reddit API. Both offered distinct challenges. The Reddit API would require mastering oAuth, a huge pain point in a time constrained situation, as well as dealing with a limitation of 30 queries a minute, which is much less than it might seem at first. For reference, initially profiling a subreddit would have taken 100,000 queries, or about 55 minutes per subreddit at 30 calls a second.
The first thing we did was map out what a solution involving the API would involve. Careful calculations suggested that the kind of mapping we wanted (1,000 users per subreddit and 1,000 posts), would slow our data gathering to a crawl, and the prospects were not much better with a self-deployed crawler, constrained by the Reddit refresh limits. The bottom line: to get enough usable data we had to have a more layered approach. We settled on using the API to gather the top 50 posts of each subreddit and querying the latest 100 posts of each of those users in order to generate an initial profile. The plan was that after a certain amount of time, another task would pick up with further building those connections by polling more users.
As part of the collection process, we developed a gem to communicate with the Reddit API. This decision was based on a desire to encapsulate the code for communicating with the Reddit API separate from the scope of the app proper. By extracting the logic for communicating with the API from the rest of our app, we decoupled our app code from the API making it more resilient to change, and by extension more modular. This was hindered by the lack of detail in the Reddit API docs, which were at times rather misleading.

The gem makes it easy to retrieve data from Reddit’s API. In particular, the gem can make multiple requests to the API to collect more than the single request limit of 100 records without any special input from the dependent code, making it much more versatile than our initial implementations.
At the time of this writing, data is scheduled to be gathered on the hour, every hour, by virtue of a pseudo-cron task courtesy of Heroku, which will continue to expand and populate the database. As time progresses, we will narrow the task to refocus it on existing subreddits.
Deep Dive: Visualization
Having a bunch of data is no fun if you can’t see it. We decided to use D3, a JavaScript library for data visualization, to help create our graph. We first focused on making the graph look the way we wanted while displaying dummy data. Once the layout looked good, we started to add on features to make the graph interactive.
If you look at the graph, you’ll notice that the nodes organize themselves to be evenly spaced out. This is achieved by leveraging a light physics engine that ships with D3. Each node has it’s own static charge that repels other nodes, while simultaneously being pulled towards the center of the graph by a center point of gravity.
We used collision detection to make the graph feel more like a real artifact, and keep nodes from ending up covering each other. This presented an interesting challenge: every time a node moves, we’d need to check if its position overlaps with any other node. You can imagine that with hundreds of nodes bouncing around at once, this is just too much work for your browser to do.

Our solution to this was to use D3 to split our graph into a quadtree. A quadtree is a data structure made of nodes, each of which have four connected subreddits. For this graph, the top node off the quadtree represents the entire SVG canvas that contains the graph. That top node’s four child nodes each represent one of four quadrants which make up the entire graph, and each of their four child nodes are a quadrant that together form the quadrant represented by their originating subreddit. This structure let us “zoom in” on our graph, and stop zooming as soon as we found a quadrant that contained one and only one node. It made the nodes faster to locate when checking for collision. More importantly, we don’t have to check each node against every other node, because we can “zoom in” on the section of the graph closest to the node that we are checking. This eliminates huge swaths of computational time. For the nerdier among you, using this quadtree brought our time complexity from O(n²) (aka bad), to O(n log n) (aka so much better).

Once the graph looked nice, we just had to bring it to life with dynamic data. This is done by simply making an AJAX request to our server whenever a node with connections is clicked. Once a node’s connections have been loaded, we cache them in the browser’s memory to keep things quick. The rest of our functionality, like expanding all connection-ladden subreddits simultaneously, or showing a path between two given subreddits, are achieved with the same principle.
Deep Dive: Pathfinding
Pathing is a search feature that takes your starting node (whatever subreddit the graph displays first) and finds a connection to a second given subreddit (an end node). The path finding algorithm came with its own considerations. Since we had persisted connections of varying strengths between subreddits but were only displaying the top connections within our visualization our pathing had the potential to display paths that weren’t explorable through the main graph. To get around this we limited our pathing to only traverse the visible connections.

To generate pathing on the rails side of the app, we build a list of subreddits as a tree, where each subreddit has a ‘parent’ node and their top connections are searched via a breadth-first search. We begin the search with our start node and check each connection against the end node, after all those first level connections are checked, we continue to the second level connections. All nodes that have already been checked are tracked so we don’t perform redundant checks for subreddits we’ve already explored for a connecting path. This way we look for the shortest list of connections between two subreddits. Once we’ve found our destination subreddit, its a simple matter to traverse back up the path following each parent in turn.
Challenges and Lessons Learned
Working on the Reddit Visualizer project highlighted the value of writing a thorough test suite. While we pair programmed often, there were times when we worked alone. Practicing test-driven development while coding solo helped by catching bugs and guiding design in the same way a pair would. The usefulness of our tests went beyond the times we were coding solo of course. When pairing together tests had the benefit of protecting against regression when refactoring and serving as documentation for teammates new to the code.
Further, the value of thorough planning cannot be underestimated, by planning out our data gathering ahead of time and planning exactly what was needed completing tasks was a lot more feasible. Even when confronted with weak documentation, cross browser compatibility issues and framework specific issues.
One of the big takeaways is how difficult and time intensive relatively simple data gathering can be. Volume is an issue that is not easy to solve cheaply or efficiently while keeping in the rules of a given API. While we came up with a workable approach, a lot of time was spent dissecting the best way to get enough data and what exactly enough data constituted.
Specific Errors, Bugs and Bloopers
Accurately representing data was of the utmost concern for us as a team but we did have to make concessions. One of the main challenges that we ran into when trying to visualize the collected data was that of giant, general-themed subreddits being ubiquitous. To resolve this we exclude the representation of subreddits with a subscriber count of more than 11,000,000. While there was heated debate about whether or not that harmed the accurate portrayal of data, we ultimately decided that subreddits, such as AskReddit, to which new accounts are automatically subscribed, masked more interesting and meaningful connections due to their pervasiveness.
As a team we also had to decide the fate of nodes that were already present on the graph and whether or not they should be represented more than once. Again, we ultimately decided to exclude subreddits over 11,000,000 and decided to show them as grey-blue nodes to give a more complete picture of subreddit connections. This led to a few interesting bugs upon implementation — source subreddits were being removed from their initial spot in the graph to become destinations of a new source subreddit.
We solved this by storing our repeated nodes in the nodes array to be rendered by D3 with decrementing ids, starting at -1 and decreasing with each repetitive node.
Another compromise we had to come to was how many connections should be present on the graph for each subreddit. Our collection method was limited to the top twenty connections of any given subreddit, because anything more visually made our graph a little messy.
D3 physics were a little finicky and took a lot of tweaking to get all of the forces acting on the elements correctly. Not to mention getting the scales for the size of the line that should be rendered in order to correctly depict the connection. We started out with a larger scale — implementing a linear scale which we ended up switching to a logarithmic scale that seemed much more appropriate in the end.
It definitely came together and became more polished over time until we came up with a product we were pleased with and worked how we expected it to. Until it didn’t…
This particular bug came from D3’s method of rendering of new nodes by selecting a random coordinate on the SVG canvas. Our function for resolving node collision used a node’s x-coordinate as a denominator; so, when D3 randomly selected a value of 0 it would equate to new coordinate of -Infinity. Literally.
As you could probably guess when we tried to perform any further calculations on the node’s coordinates it would equate to “NaN”, which made this bug particularly tricky to track down. Overall the bugs were numerous, and pretty sneaky, but in the end it was definitely worth all the effort put into it. Watching our data grow over time as it was being collected was awesome.
We all knew that we had built something we were happy with when we had to force ourselves to focus when poking and prodding the application to look for weird behavior instead of getting sidetracked and exploring paths and how subreddits were related to one another.
TL;DR
- Coding hard
- Made it work
Find out more about the authors here — we’re all looking for jobs: Anthony (Chicago), Catherine (NYC), Christian (Austin), Felipe (Philadelphia), Jonathan (SF).