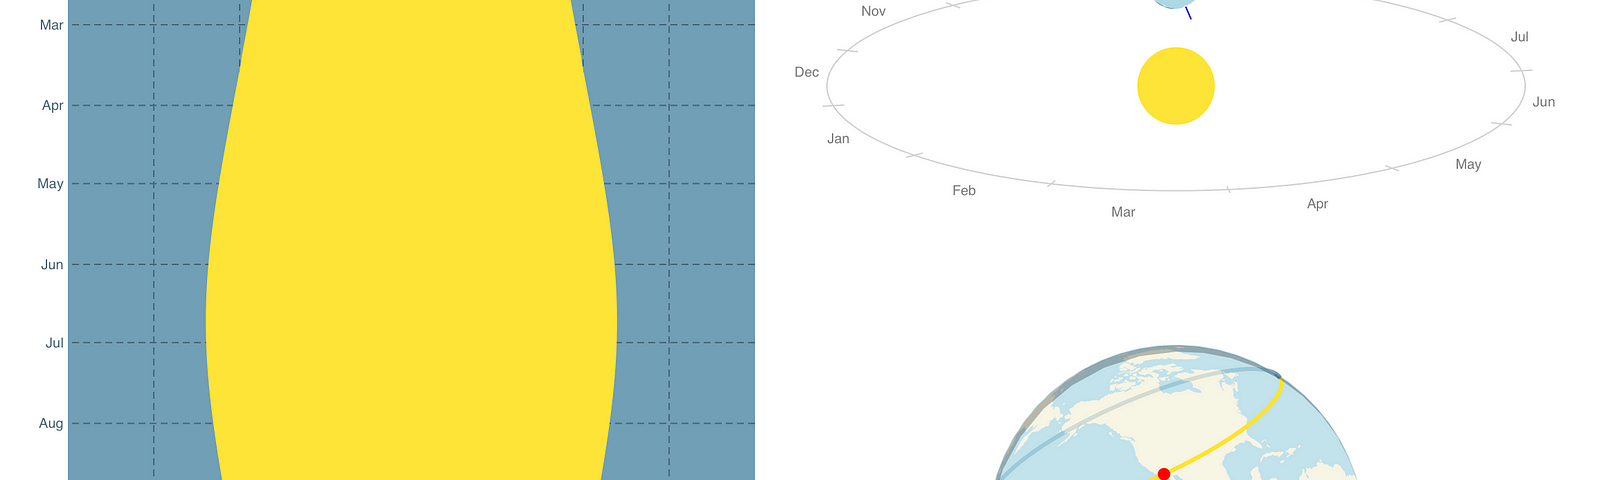
I wrote a tool using d3.js to visualize how and why the length of day changes throughout the seasons. See the whole post on Observable.
I’ve been following Mike Bostock, the creator of the excellent d3.js library that powers many of the data visualizations on the web. He has been touting his new platform, Observable HQ, an online javascript notebook environment similar to that of the…
When I was a researcher in neuroscience my primary field of study was investigating the electrophysiology of neuronal ensembles using multi-electrode arrays (MEAs). Throughout our work we discovered and advanced techniques to view action potential propagation on medium density arrays…