How Javascript manages memory
What the Chrome and Firefox profilers teach us about Garbage Collection
Memory affects performance. When your application code consumes too much memory, you get a laggy application and maybe even out of memory crashes.
When you run an application in a web browser, most of the application memory is stored in the Javascript heap, which lives within your computer’s RAM. In the context of a React application, common objects stored in the JS heap are: component instances, the virtual DOM, and if you use Redux, the Redux stores, actions, and reducers.
As you interact with an application, the JS heap can grow over time. You can see this growth when you take a profile with the Chrome DevTools.

I took the above screenshot after scrolling through the Medium homepage for a few seconds.
Because memory growth impacts application performance, it’s very important to remove unused memory to free up space. The process by which Javascript engines reclaim unused memory is called Garbage Collection (GC). Javascript engines do automatic Garbage Collection, unlike some languages like C and C++.
Browser profilers like those in Chrome and Firefox reveal many insights into the internal workings of Javascript. For instance, in a previous blog post, I wrote about what the Chrome profiler reveals about the event loop. If you’re not familiar with profiling or Flame Charts, check out this aforementioned blog post first:
You can also learn quite a lot about how Garbage Collection works in Javascript from these browser profilers. Let’s start with the Chrome profiler.
Javascript employs Major GC and Minor GC to clean up JS heap
To record a profile on Chrome, open the Chrome DevTools and navigate to the Performance tab with the “Memory” checkbox checked.

I took a recording of me navigating between tabs in the Medium home page:

This is the profile the Chrome profiler produced:

You can see that the heap grows and shrinks. If you take a closer look, the drop in heap size aligns with Garbage Collection activity. The frame Major GC means a Major Garbage Collection is happening.

You will likely see this pattern in any site when there is a large drop in JS heap size. In fact, if you were to switch tabs within an SPA and the JS heap does not drop in size significantly, but the contents of the tabs differ, it could be a sign of memory leak.
You will also see Minor GC frames in profiles.

These Major GC and Minor GC frames tell you a few things about Garbage Collection in Javascript.
- There are 2 types of Garbage Collection: Major GC and Minor GC.
- Minor GCs are generally very short while Major GCs take longer time.
- The fact that you see them as frames under “Task” suggests they both run on the main application thread.
- Because they run on the main thread, they block Javascript execution, as browsers only have 1 main thread to run your Javascript code.
- Because they block Javascript execution, too much GC impacts performance of your application.
Note: GC only blocks Javascript execution sometime. It doesn’t block the whole time it shows up as as a frame. We can’t see this in the Chrome Profiler, but we can in the Firefox profiler.
So let us now take a look at the Firefox profiler, which also reveal insights into the differences between Major GC and Minor GC.
Major GC and Minor GC clean up 2 different parts of the JS heap
I am not a Firefox user, and the only reason I downloaded Firefox onto my laptop is because of its profiling capabilities. The Firefox profiler is open sourced and does have more visualizations than the Chrome profiler.
Record a profile and navigate to the “Marker Chart” visualization. The Marker Chart is essentially a timeline of all the different kind of activities collected, including Garbage Collection activities.
The first thing you might notice is that Minor GC happens quite frequently whereas major GC does not. This is for good reasons because, as mentioned in the previous section, Minor GCs are short whereas Major GCs take a longer time.
If you hover over a Minor GC slice, you get the description:

Thus, aside from the fact that they run at different frequencies, Major GC and Minor GC also clean up different parts of the JS heap.
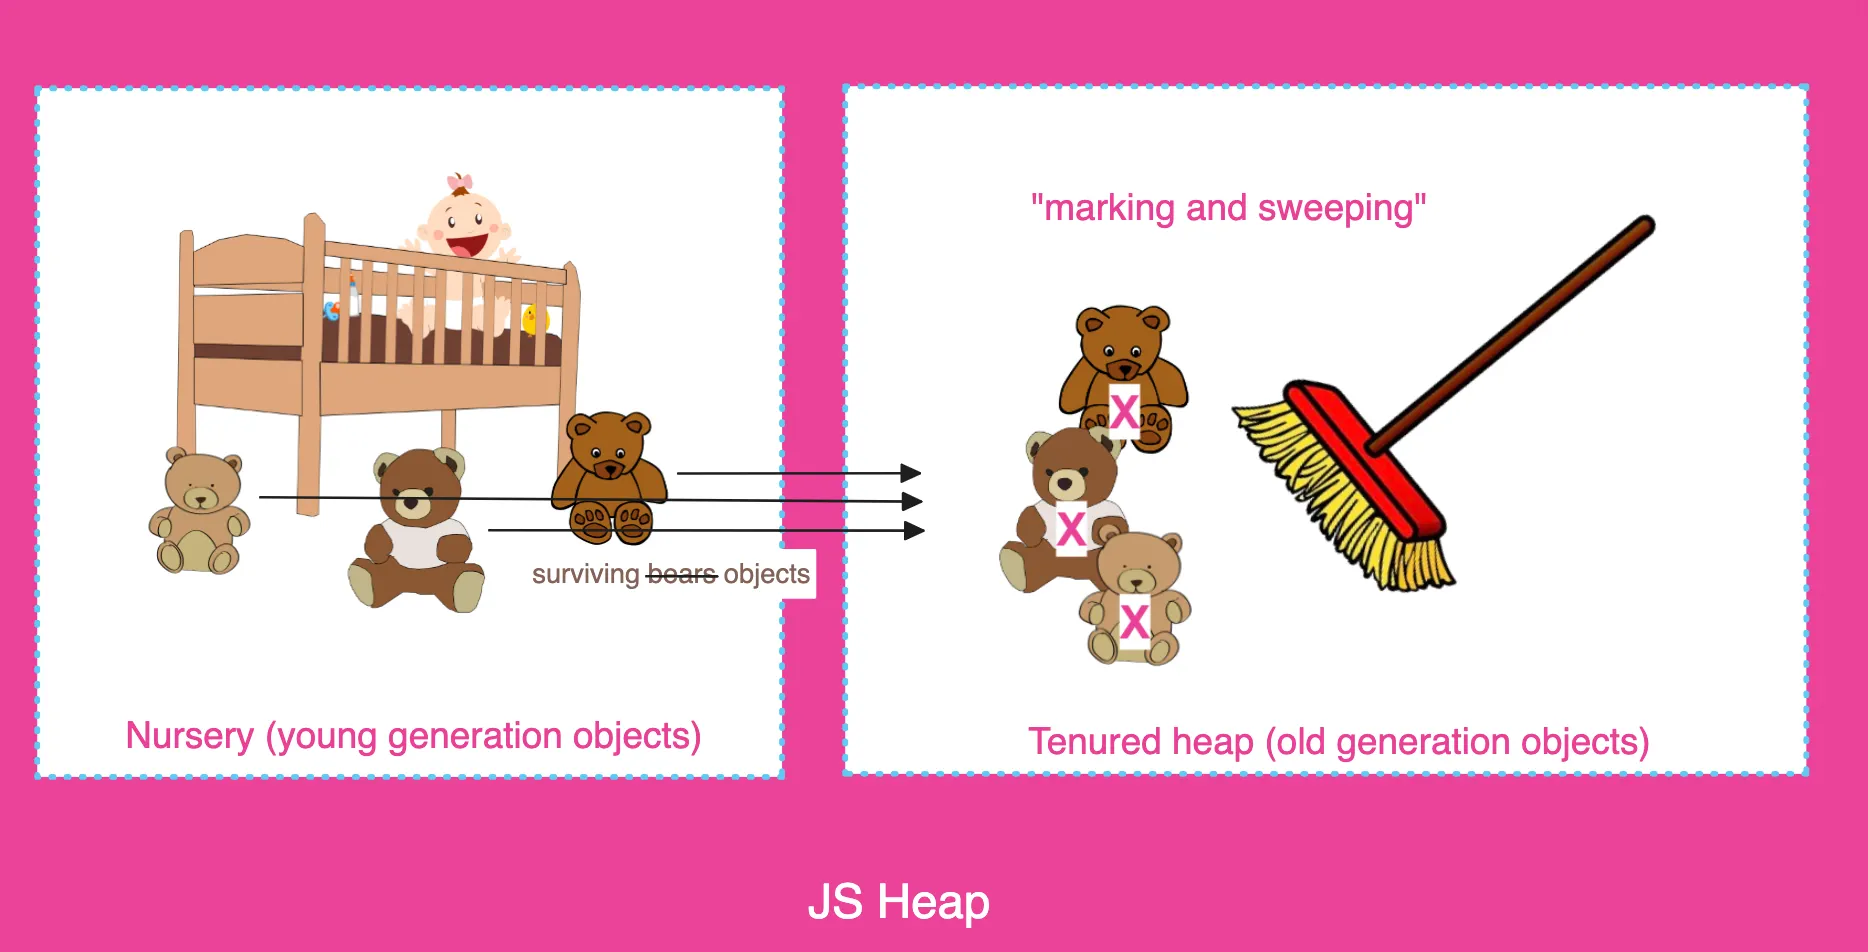
As described, Minor GC clears out a so-called “nursery collection”. If objects survive Minor GC, they are moved from the nursery onto the “tenured” or “long-lived” heap. Thus, Major GC must be what clears the tenured heap.
The Major GC cleans up the tenured heap via an algorithm called mark-and-sweep, which we’ll get into shortly.

Now we know that JS heap has at least 2 components: a nursery collection for recently allocated objects and a tenured heap for longer lived objects.
Major GC algorithm (incremental mark-and-sweep)
There is also a GCSlide in the screenshot of the last row in the Marker Chart. Hmm, what is that?
If you hover over the Major GC rectangle, you get a description for Major GC:

The entire Major GC took 580ms. However, as the description says, the main thread is only blocked for the individual slices. The GCSlide on the last row, thus refers to these blocking slices. Further down, you see that total slice time is 34.4ms, so that’s only 34.4ms of work when the Javascript main thread cannot execute application code.
If you hover over one of the GC slices, you get:

Notice both tooltips have a “Phase mark” and “Phase sweep”. What this says is that Javascript Garbage Collection has 2 phases: marking and sweeping. This algorithm is called mark-and-sweep. Notice that the description for GC slice says “one slice of an incremental garbage collection.” Incremental GC is a way of implementing the mark-and-sweep algorithm.
The marking phase “marks” all objects reachable from the root set (e.g. global variables, active function calls) by traversing the object graph. The sweeping phase then “sweeps” through the heap to collect and free the memory of all unmarked objects, which are considered unreachable and thus garbage.
I’ve found a great visualization of the mark-and-sweep algorithm from this blog post.

Incremental means you’re doing the marking phase in increments, thus minimizing the amount of time the main thread is blocked.
Chrome vs. Firefox
I want to surface some nuances when it comes to Garbage Collection in Javascript.
Chrome (along with NodeJS) uses the V8 Javascript engine. Firefox on the other hand uses a different engine called SpiderMonkey. It is the Javascript engines that come with Garbage Collection. V8 uses the term “young generation” instead of “nursery” and “old generation” instead of “tenured heap. ” However, both V8 and SpiderMonkey use Minor GC to clean up young objects and Major GC to clean up old objects. Both implement an incremental mark-and-sweep algorithm for Major GC. The specifics of the incremental mark-and-sweep algorithms though do differ between V8 and SpiderMonkey.
In summary:

Profilers reveal the unknown unknowns of how a language works
Profilers from Chrome and Firefox reveal many insights about the internal workings of Javascript, but they won’t tell you exactly how things work. For example, to get the specifics of mark-and-sweep algorithm, you’ll have to dig into other resources.
What the profilers ARE good at, is revealing the unknown unknowns.

I rarely (maybe even never) encountered concepts like young generation, old generation, mark-and-sweep during my day-to-day life as a React application developer prior to joining the profiling team at Datadog. I knew memory leaks are bad, but I didn’t know the specifics of how memory is cleaned up in Javascript, and I didn’t know what I didn’t know.
A simple look at a profile can reveal a plethora of information, and thus surface the unknown unknowns of that profile’s runtime. I find that extremely cool!