Tectonic plates and where to find them
The scale of the world I’m trying to build is massive. The map covers 30 degrees of latitude, which is about the size of Australia surrounded by a fair amount of ocean. We are talking of a square 3300 km wide. More than 10 million square km. I’m going to have countries, federations and empires on this land. To really get an idea of the scale, I usually render it as a square 800 pixels wide for testing, so each pixel of the map is a patch of 16 square km. Most of the city I grew up in, and its 20k citizens, would fit inside one pixel of this map.
This means the “island” in my map is not just an island, it’s a continent. On an island, often the elevation of a given point is roughly proportional to the distance from the coast. It’s not always the case, but it’s a fast and effective technique. Unfortunately, this is not the case with continents. Continents have big areas of flat ground, big areas of not so flat ground, and mountain chains. This is the effect of the process known as “plate tectonics”, and I’ll have to simulate it if I want to get anywhere.
Luckily the process can be approximated very easily. We just need to define some plates and then we can smash them onto each other.
Creating the plates is something we can do with a graph search. The graph is defined by cells of the Voronoi diagram we used to create the shoreline. In each cell we have an array with the IDs of the cells that border it. We can pick a few random cells as the starting points of our plates, and expand them until they touch each other. This is pretty simple, and gives us control over the relative size of the plates. We can execute more iterations for one of the plates if we want it to grow more than the others, or we can have them grow at the same speed.
For simplicity I stop expansion of the plates when they reach the coast. I’ve manually added some purely oceanic plates, which are currently unused.
But how do we get an elevation map from this? This is the point where the “tectonic” part kicks in. Plates move around and exert pressure on each other when they push on each other. Mountain ranges arise in those points, as the continental crust is pushed upwards.
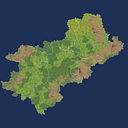
As you can see in the above map, our tectonic plates are much smaller than the ones you can find “in the wild”. This is because plates merge and split all the time, and we need to account for events that take place over millions of or billions years, so we need a much finer granularity. I actually keep track of the age of each plate, but I’m not currently simulating merging and splitting.
So we just need to apply a force vector to each plate and find the points there the plates touch each other. In the border areas where the force vectors of two Voronoi cells are vaguely opposing, we place and “orogeny” event.
How to approach an orogeny event is an implementation detail. In my case, I place a bivariate (2d) bell curve curve on the map, align its centre with the centre of the cell where the orogeny event occurs, apply random deviations to it, rotate it to a random degree and scale it proportionally to the orthogonal component of the opposing forces. I then go through all cells in the diagram and add up the values of all the bell curves that overlap any single cell, to get the initial elevation of that cell.

