How can I measure the Cost Competitiveness of All Suppliers? Chapter 10
Chapter 10 — Establish a “Good Quote” scoring system

Each RFQ exercise involves comparing quotations from different vendors. It is an inherent part of every Procurement transaction. The default expectation is to buy from the most competitive vendor out the all the suppliers. If you are measuring the price difference between all suppliers in a quotation, it is called Price Avoidance.
Cost Avoidance = Price of Most Expensive Supplier — Price of Most Competitive Supplier
However, Cost Avoidance does not mean Cost Saving. Cost savings must be measured from the “last purchase price” or “historical price” for the same item. One can argue that macroeconomic indicators may make the comparison inaccurate, but as said in previous chapters, you can consider a discounting factor if required.
The problem with the above-mentioned method is it forces the buyer to focus on the commodity only and not the vendor (like we saw in Chapter 09). As one vendor can supply many different items, we will see how to develop
- A Supplier Price Index for all the items supplied
- Create A “Good Quote” scoring system where a supplier is rewarded for giving us the best trade
Continuing from our last chapter (Chapter 09), we will arrange a summary by the Vendor view.
B.) Summary by Vendor View:
Let us start. Arrange your pivot table according to the picture shown below

1. Filters Section:
1.1: Put field “Range Selection”
1.2: Choose its value as “Include”
2. Rows Section:
Put the following fields in the order shown below
Legal Name
Commodity Description
S.No
3. Values Section:
Put the following fields in the order shown below
Average of Minimum Price
Average of Unit Price
Average of Vendor Price Index
Average of PPV%
Sum of Best Quote Score
Count of Range Selection
Sum of Extra Cost
Sum of Item Total Amount (i.e PO Value)
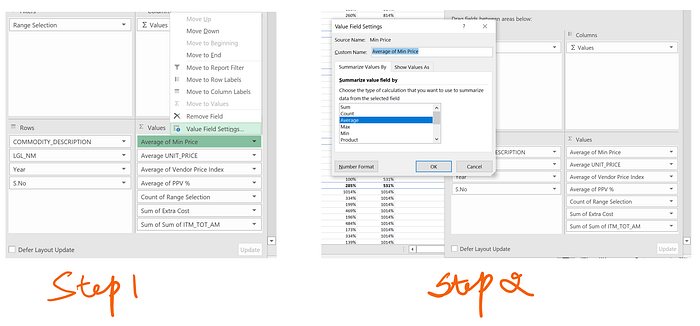
As explained in the previous post, you can choose Average, Count, Sum properties from the drop-down available in the Values section. Refer to the picture below for details (Follow Step 1 and Step 2)

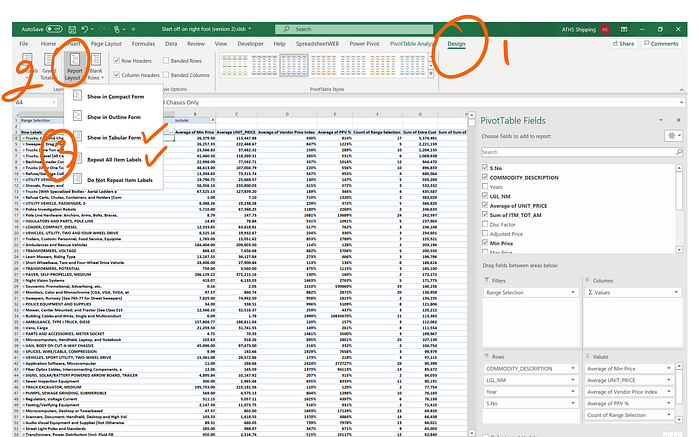
As explained in Chapter 09, One last step is to rearrange the layout of this table to improve visibility. Here are the steps to do so:

1: Click on Design
2: Click on Report Layout
3: Select Tabular Form & Repeat All Labels
Done! Our Vendor View Summary is now ready. It should look like as shown in the picture below:

Analysis: How to read this table?
Let us look at the table shown below and look at 3 columns

- Sum of Extra Cost
- Count of Range Selection
- Sum of Best Quote Score
The Sum of Extra Cost represents the overall premium/extra cost we have paid to vendor “Longhorn International” when compared to the cheapest vendor. To further see the details, you can click on the “+” icon and expand

As you can see, we have purchased 3 types of commodities from “Longhorn International” (and paid USD 2.17 Million in extra costs!). Especially, for “Trucks, Cab, and Chassis”, we placed 4 POs (represented by Count of Range Selection). Out of 4 POs placed, not a single PO was purchased at the lowest price (and hence the Sum of Best Quote score is 0).
Let us expand the “Trucks, Cab and Chassis Only” field by click on the “+” icon.

For Purchase “6286” (represents the serial number 6286, you can refer to final datasheet and navigate to serial number 6286 for line item level details), you can see the minimum price was USD 26370.50 (as represented by column “Average of Min Price”, marked as A). However, we purchased the same item from “Longhorn International” as USD 147,262.00 (as represented by column “Average Unit_Price, marked as B). That means we paid 5.5 times more price to “Longhorn International” (as represented by column “Average of Vendor Price Index”, marked as C).
Also, the price of “Trucks, Can and Chassis” has a variation of 814%. This means it is a high price variation items where the price can vary up 8 times (between the lowest purchase to highest purchase). Usually, this should be a red flag as for any indirect procurement commodity, having a high price variation is abnormal.
Let us bring the focus back to the overall Vendor level.

We will now use these two columns, i.e., “Sum of Best Quote Score” and “Count of Range Selection” to populate a % score. The objective is to find vendors with a high % of good quote scores and vendors with low % of good quote scores.
To do this, copy this information into a new excel file and label it as “Good Score %”. The newly inserted column is highlighted in the picture below.

Here is the formula of calculate Good Score %.
= F2/G2
Where
Column F refers to the Sum of Best Quote of Score
Column G refers to Count of Range Selection
One last step that is left to focus on prioritizing our attention only to cases where Extra cost is high and Good Score Quote % score is low.
To do so, follow the steps shown below:
First Step: Setup Filter for Extra Cost Paid
A: From Column “Sum of Extra Cost”, click on Dropdown menu
B: Point to “Number Filters”
C: Select “Greater Than or Equals To”
I have decided to focus on Extra cost with a value greater than USD 50,000 only. You can decide according to your business requirements.

Second Step: Setup Filter for Good Quote Score
A: From Column “Good Score %”, click on Dropdown menu
B: Point to “Number Filters”
C: Select “Less Than or Equals To”
I have decided to focus on vendors who have a good quote score of less than 30%. Again, this is a judgment call and you can choose the value accordingly.

After performing the above-mentioned steps, the final output looks like the following:
We have the final list of 38 vendors, to whom we have paid $ 14.7 Million in extra costs and they have good quote score of less than 30%.

We now can focus on replacing these vendors with better ones. To replace these vendors, we will have to go item by item approach (as we explained in Chapter 09) and replace these vendors with the most price competitive vendors in that category. We have already seen in Chapter 09 on how to locate the best-priced vendor.
Chapter 11:
In this next chapter, we will list down some of the basic ratios of Spend Analytics which we skipped intentionally in the beginning. We skipped them because that information can easily be found in most of the articles available online.
Link to Chapter 11 : https://medium.com/@g../popular-kpis-limitations-of-excel-for-spend-analysis-chapter-11-3939812e5832
I will appreciate your comments so that I can improve these lessons further.
For short summaries on upcoming procurement lessons, you can always
Subscribe to my publication: https://medium.com/procurementintel
Follow me on LinkedIn: https://www.linkedin.com/in/gsrm/


