
Why join the next Sentinel Hub Custom Script Contest
Learn more about the awarded scripts and what it takes to write a useful custom script in EO Browser!
The growing interest in Earth observation (EO) in the last years made many realize how useful and valuable satellite data are. It has also resulted in the development of numerous applications using remote sensing. Freely available web applications like Sentinel Playground and EO Browser give everyone with internet access the opportunity to explore and visualize satellite data in almost real-time. The powerful feature of custom scripting within EO Browser provides deeper insight and easier analysis of the data. To spread its awareness and activate more people helping everyone understand our planet better, our Sentinel Hub team partnered with the Copernicus EU Earth Observation programme and the European Space Agency (ESA), and initiated the Sentinel Hub Custom Scripts Contest.
The success of the first Contest organized in Spring 2019 motivated us to start planning the second one. By reading this blog we hope you will get an impression of how easily you can create useful custom script and get the motivation to submit your own. You will already have a chance to do so in the coming Autumn.
What it Takes
All the scripts submitted to the Contest need to run within the EO Browser. This fact actually makes your job as a participant as easy as it can be. EO Browser offers a powerful option of inserting your own custom script and see immediate results visible on the selected satellite data. Since it provides you with access to various data sources globally, you will be able to test your script on different cases all around the world.
Writing a useful custom script for the EO Browser gives you the opportunity to better understand our planet and win some awesome prizes on the way.
You can higher your chances to win an award by simply putting several irons in the fire. You are allowed to hand in up to three different scripts either as a single author or as a representative of a group. The Contest can even become an interesting project either for high school or university science classes.
There are several requirements which need to be considered. Together with the script, you will have to hand in a description on what your script can be used for and an explanation on how it is achieving that. Beside general description of the script the following information is required:
- Scripts applicability
- False detection problems (if any)
- Detailed description of how the script works
- Representative cases / images with details
- Visualization in EO Browser (a link to a working script)
- References
- Credits
During the evaluation process the scripts will be evaluated by their originality, scientific relevance, global applicability, business/commercial potential and visual appeal. The best three scripts and the best SAR script will be awarded with attractive prizes.
Where to Start
Even if the next Sentinel Hub Custom Script Contest starts on October 15, 2019, there is no reason for you not to start exploring the capabilities of EO Browser and play with custom scripts already today.
And if you are new to custom scripting, no worries. As preparation for the next challenge, we have created a short Custom Script Tutorial which will help you create beautiful and informative satellite images for your own purpose. With a little help of our friendly PDF tutorial you will be able to create simple custom scripts and continue investigating on your own.
Some help and instructions on how to get started with custom scripting can also be found at the following links:
- Creating a script in EO Browser
- Technical description on scripts
- Concept behind scripts
- Custom script repository
We hope that we triggered your curiosity and give you just enough motivation to dive into the beautiful world of the custom scripts. If you decide to participate in the Contest even better. But, if you still need some convincing, continue reading and learn more about the awarded scripts from the first Contest! You just might get the right idea to get you started.
Follow us on Twitter to stay updated and join our Forum with the dedicated topic.
Awarded Scripts from the First Contest
All the awarded scripts that were submitted to the Contest in Spring are at your disposal on our GitHub repository. For direct links see the list of the results by categories below. The winners were announced during the Living Planet Symposium in Milan on May 15, 2019 and published on the Contest’s web page.
We were most pleased to see many students among the participants and we hope that the Contest becomes an interesting project either for high school or university science classes in the future.
Received scripts were categorized in several categories, such as Agriculture and Forestry, Marine environment, Snow and Glaciers, Disaster management and prevention (wildfires, floods, hurricanes, etc.), Air quality and Urban planning, and other scripts (all not fitting into one of the other categories).
Agriculture and Forestry
- Anomaly Detection — Jean-Baptiste Pleynet, Luxemburg
- Forest Cut Temporal Detection — Nicolas Karasiak, France
- Pseudo Forest Canopy Density (pseudo-FCD) — Antonio Carlón Paredes, Spain
The winning script in the category of Agriculture and Forestry is the Anomaly Detection script which has a goal to calculate the “anomaly” of an index, avoiding clouds. The author used the Normalized Difference Vegetation Index (NDVI), but this can be easily changed. To read more about his multi-temporal script we recommend reading our guest blog post Sentinel Hub supporting IBISA in the Crop Micro-Insurance Field.

The Forest Cut Temporal Detection script exposes the importance of forests and their essentiality for wildlife, biodiversity and to fight climate change. In order to map forest cutting from one year to another, this script compares:
- the mean NDVI of the three previous months from the selected image
- to the mean NDVI of the three same months but from the previous year
For more details, we invite you to continue reading the author’s guest blog post Mapping deforestation with Sentinel Hub.

Pseudo Forest Canopy Density (pseudo-FCD) script classifies each pixel into one of the categories (High Forest, Low Forest, Grassland, Bare Land, Water and Unknown). This allows the user to explore forest zones to fight deforestation, for agricultural purposes and even for city planning.
FCD is calculated using four different indices, such as Advanced vegetation index (AVI), Bare soil index (BI), Canopy shadow index (SI) and Thermal index (not used in author’s script). The pseudo-FCD script (and hence the name) implements a custom version of the AVI, BI and SI indices. It can be used with Sentinel-2 L1C and L2A.
As the main drawback, the script has problems with some water bodies. Although the default thresholds for each category work quite good for most of the situations (and locations), they can be tweaked depending on the location to fine tune the results. The script can also be configured to avoid detecting water bodies.


Marine Environment
- White-Water Detection — Mohor Gartner, Slovenia
- Ocean Plastic Detector Prototype — Bence Mélykúti, DPhil (Oxf), Germany

The White-Water Detection script can be used for mapping white-water zones. Its primary focus is on detecting the white-water on the coastline. It can also be used for the detection of white-water on rivers. The most useful way to analyze white-water zones is with multi-temporal analysis. Nevertheless, it can also be used directly on a single image.
The White-Water Detection script has many benefits among which are improvement of bathymetric mapping from multi-temporal analysis of Sentinel-2 data, erosion level evaluation, identification of reef or submerged reef, bathymetry slope evaluation, civil engineering (potential location for new ports, coastal protection structures and measures), maritime navigation, wave hydrodynamics (swell direction etc.), surf zone habitat identification, wave breaking numerical modeling validation, detection of new reef or island, wind conditions detection, ships location, new surf spots identification and similar.
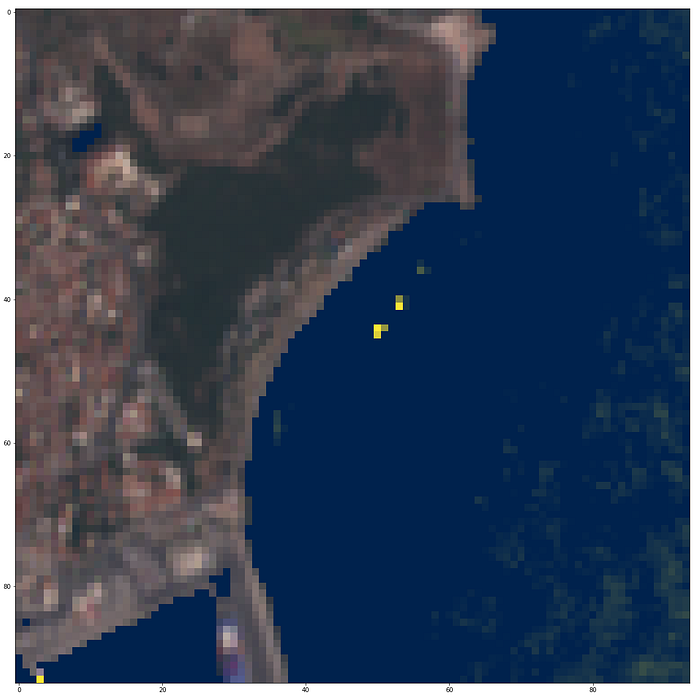
The second runner in the category Marine Environment is the Ocean Plastic Detector Prototype script which is adapted to Sentinel-2 Level-1C images. It separates land from water using the Normalised Difference Water Index (NDWI) and displays land in natural colour. On the water, it should display the presence of plastic in the water on a dark blue/yellow scale, with dark blue representing no contamination. The prototype does not work reliably but it is a proof of principle in an emerging and pressing area with current, active research.
Snow and Glaciers
- Monthly Snow Report — Nicolas Karasiak, France
- Snow Cover Change Detection — Karl Chastko, Canada
The winning script in the category Snow and Glaciers — Monthly Snow Report — is exposing the areas where snow is persistent for the last 30 days (from the chosen date). In order to well represent the land-cover, the script will store each pertinent date in a list and will represent the median value.
The script has a few limitations such as detecting white rooftops, and the situations when no unclouded pixel is available in the previous 30 days. Thus, it is possible to make the script working with 90 days in order to have a trimonthly synthesis.

The Snow Cover Change Detection script calculates the Normalized-Difference Snow Index (NDSI) for any given region for the last three months and renders the results so that areas which have gained/lost snow can be easily identified. This script works great for viewing snowfall in the autumn months or snow retreat in the spring. Additionally, this script can be used to visualize glacial retreat or advance in polar or high mountain regions.

Disaster Management and Prevention
- Detecting Deep Moist Convection with Sentinel-2 — Stavros Dafis, Greece
- Seldom and Regular Water Surface Detection — Mohor Gartner, Slovenia
- Fire Boundary script — Adzanil Rachmadhi Putra, Fatwa Ramdani, Indonesia
The author of the Detecting Deep Moist Convection (DC) with Sentinel-2 has developed a very simple script for detecting DC with the Sentinel-2 L1C dataset which can be modified for the L2A and Sentinel-3 datasets as well.
Deep moist convection (DC) is associated with hazardous weather phenomena such as torrential rainfall and flash floods, severe convective wind gusts, large hail, and tornadoes. The latent heat release inside deep convective clouds plays a crucial role in several phenomena, e.g. the intensification of hurricanes and cyclones in general. Several studies have shown that DC and overshooting cloud tops penetrate the lowest stratosphere and allow the exchange of gases from the troposphere deep into the stratosphere.
The author describes the performance of the algorithm in a case study in Greece in April 2019. There is a potential for this script to be further optimized and evaluated in the near future and he would be interested to use external sources to provide the best possible results.

The main goal of the Seldom and Regular Water Surface Detection script is to identify possible seldom water zones (flood areas, karst lakes, sinkholes, springs, etc.; red colour) and regular water zones (lake, river, etc.; blue colour) in a selected timeline. In addition, the script identifies locations with high inclinations of terrain (building, road, bridge, ridge, cliff, mountain, hill, etc.; white colour).
The results of the script can be used as a basic tool for warning flood maps. Alternately, the script can be also used for monitoring water surface extend in (artificial) lakes or open reservoirs. It must be used only in multi-temporal processing with a fair number of samples (recommended 30). Value of data (VV, VH, etc.) varies strongly with satellite orbit in mountain areas. Therefore, the script might not be as useful as in flat or low hills areas. In addition, detection of flash floods is almost impossible as a result of resolution (10m) and time limit (usually maximum is only one image per day).

The third runner in the category Disaster Management and Prevention is the Fire Boundary script. In the case of wildfire, it is very important to understand and measure the impact of the event. The script exposes the boundary of the affected wildfire area in more contrast and detail. The author of the script used the Sentinel-2 data with band 11 and band 12. Using a higher coefficient number lead to more contrast visualization. This script is benefiting not only for firefighters to manage the spread of fire but also for recovery management effort.

Air Quality and Urban Planning
- Green City — Carlos Bentes, Estonia
- City Highlights — Thales Sehn Körting, Brazil
- Sentinel-1 Urban Areas — Monja Šebela, Slovenia
A simple but efficient Green City script uses the NDVI to color Sentinel-2 images and create awareness of green areas in cities around the World. Green spaces represent a fundamental component of any urban ecosystem. They facilitate physical activity and relaxation, and form a refuge from noise. Trees produce oxygen, and help filter out harmful air pollution, including airborne particulate matter. Urban parks and gardens play a critical role in cooling cities, and also provide safe routes for walking and cycling. The script can serve as additional resource in urban planning and analyzing air quality in the cities.


The algorithm within the City Highlights script is a combination of 3 binary maps, based on the well-known NDVI, NDWI, band ratio and Normalized Difference Built-up Index (NDBI). Although we know that every location has a different behavior, the author applied crisp thresholds to those indices (plus the ratio of visible bands). The thresholds were defined empirically. The result of the script is particularly useful for an overview of where are the cities, and their relations to water bodies and vegetation areas.

The Sentinel-1 Urban Areas script is useful for locating urban areas and individual buildings. It uses VH and VV polarizations to highlight different buildings and topology orientations with purple and green colors. Radar is very accurate; it detects almost every building and is not obstructed by clouds. It can be used to track urban expansion, to detect illegally built buildings, estimate building type or locate buildings in high-risk areas (such as floods). The script does not work in high elevation areas, where snow and high elevation differences are also highlighted and it becomes difficult to separate urban areas from them.

Other Scripts
- Land Surface Temperature (LST) Mapping — Mohor Gartner, Slovenia
- Monthly Composite — Nicolas Karasiak, France
- Barren Soil— Monja Šebela, Slovenia
The goal of the Land Surface Temperature (LST) Mapping script is to define LST by using data from Landsat 8. EO Browser already has Thermal rendering, however, only brightness temperature (BT) in Kelvin is calculated. Additional steps are required for LST retrieval using bands 4, 5, 10 (and 11). The values for surface roughness, NDVI (vegetation, soil) and average emissivity of terrestrial materials are preselected to enable calculation of LST. For better results, later values should be adjusted accordingly to the specific area of analysis.
The script can be used on a single image or in the multi-temporal analysis. In case of a single image or multi-temporal average and standard deviation analysis, cloud coverage should be as low as possible, e.g. at least 10% or lower, if possible. Here would be an option to improve this script and add cloud detection algorithm, which would improve results.

The Monthly Composite script is computed with best bands ratio and meant for all who want a cloud free image representing the last 31 days. In order to select the best pixel in a month (and avoid cloud), a selection is made using a ratio:
- When blue < 0.12, date is chosen where max ratio of B08 against B02.
- If no pixel available above, when blue < 0.45, date is chosen where max ratio of B03 against B02.
- If water is detected, date is chosen where max ratio of B02 against B08.
- If snow is detected, median of scene with snow.

Barren Soil script — The bare ground index is the Bare soil index, applied to the red channel. It shows all vegetation in green and the bare ground in red. It could be useful for soil mapping since it informs the user where to do remote sensing analysis on bare ground, where crops were collected or where crops are not growing, the location of landslides or the extent of erosion in non-vegetated areas. Unfortunately, it also highlights certain buildings, making bare ground areas difficult to separate from dwellings. It should be noted, that the result depends on season vegetation and farming.

Best SAR Scripts
- Seldom and Regular Water Surface Detection — Mohor Gartner, Slovenia
- Sentinel-1 Urban Areas — Monja Šebela, Slovenia
- Forest Hurricane — Kamil Onoszko, Poland
The Seldom and Regular Water Surface Detection script was awarded as the best SAR script as well as the second best in the category Disaster Management and Prevention previously described.
The second best SAR script — Sentinel-1 Urban Areas — also won the third prize in the category Air Quality and Urban Planning.
The Forest Hurricane script helps in visualization of forest damage after a hurricane. The script is based on Sentinel-1 radar data. With the help of the script, you can specify the area of damage a few days after the disaster (regardless of weather conditions, cloudiness). The visualization allows you to quickly determine the extent of a damage and can be useful for emergency services to plan the right amount of equipment and people to help.

Best Overall Script
We were super excited to receive many useful scripts, although this meant a though job for our judges. But one thing was indisputable, the best overall script was created by Stavros Dafis from Greece. With the script Detecting deep moist convection with Sentinel-2, already described above, he won a trip to ESRIN and the first prize in the category Disaster Management and Prevention.


