Best practices to optimize Snowflake spend
Snowflake is constantly improving the value of a Snowflake credit via ongoing transparent platform improvements. Customers are beneficiaries of these improvements, quantified by Snowflake Performance Index without opting in or doing any work.
This post details best practices for customers to optimize Snowflake spend over and above the ongoing platform improvements delivered by Snowflake.
Components of Snowflake cost
Snowflake credits are used to pay for the consumption of resources on Snowflake which can be from three broad areas:
1/ Compute which is comprised of: a/ Virtual Warehouses, b/ Cloud Services, and c/ Serverless services. Virtual Warehouses are typically responsible for most of an account’s spend. Virtual Warehouses are the primary compute primitive in Snowflake with elastic & instant-on, scale up & out, auto-suspend & resume properties and are billed on a per second basis. Cloud services cost include the cost footprint of Snowflake’s control plane, SHOW commands, query compilation, result caches, etc. and are only charged when its footprint exceeds 10% of daily compute footprint from warehouses (which is rare). Serverless services include Query Acceleration, Automatic Clustering, Materialized Views, Search Optimization, Snowpipe, Replication, etc. which are paid services that provide meaningful value.
2/ Storage is usually a small fraction of the overall bill and benefits from a “pass-through pricing” model where Snowflake passes along cloud provider costs. Storage on Snowflake can also benefit from compression, which can reduce footprint by up to 7x.
3/ Data Transfer & Egress is also usually a small fraction of the overall bill. This is also cloud-provider specific, follows a “pass through model” and accrued when functionalities such as COPY, replication, external functions are used.
Best practices to optimize spend
Our best practices to optimize Snowflake spend include:
1/ Obtain visibility into cost & implement chargeback
We recommend that customers track usage at multiple granularities (such as organization, account, workloads, warehouses, users, tasks, etc.) and attribute spending to specific teams, customers, or cost centers (via tagging or other cost attribution features) to actualize “chargeback” or “showback” scenarios.
Snowflake provides granular usage data via Account and Organization usage views. This includes data meant for both finance teams and Snowflake practitioners to be able to realize a robust FinOps practice.

A number of pre-built queries can be used for common actions around gaining visibility into spend at multiple levels of granularity (per-warehouse, per-user, per-job, per-user, etc.). Additionally, tagging provides a mechanism to attribute and reason about spend in logical groupings.

In addition, a UI-based cost exploration experience enables quick and easy visual examination of dashboards detailing usage, usage trends, and timeline based drill-downs of this usage data.

Furthermore, the Snowflake Insights Streamlit App can be used to visualize usage data in Snowflake to gain richer insights into spend via visualization such as heatmaps and flame graphs for spend.

2/ Proactive budgeting & alerting
We recommend setting up budgets at the level of an account and/or custom groupings of resources and setting both proactive & reactive alerts on spending limits along with guards against overspending.
Budgets can be used to define a spending limit over a time interval for an account or a custom grouping of credit-consuming objects.

Budgets help monitor warehouse and serverless usage (i.e., automatic clustering, materialized views, search optimization, pipe, and replication). When the spending limit is projected to be exceeded, a daily notification is sent.

In addition, custom alerts can be set up to monitor and programmatically notify at based on changes at finer granularities.
3/ Workload segmentation based on Return-on-Investment
We recommend understanding the cost and return-on-investment of workloads to make informed decisions on re-architecture, decrease/increase of usage, or even retire certain workloads with the goal of ensuring the most return on spend.
Snowflake’s cost visibility features help understand the level of investment in each workload, the return on it is subjective and dependent on the business value of the use case. Based on the the return-on-investment, we recommend making decisions on re-architecture, decrease/increase of usage, or even retire certain workloads with the goal of ensuring the most return on spend.
Some of the metrics exposed by Snowflake such as warehouse load metrics, warehouse utilization metrics (in private preview), metrics on data spilling to disk/object storage, and warehouse events history (in public preview) can inform and guide optimizations to “right size” compute. Additionally, per-query costs can identify the most expensive queries to prioritize for rewriting/refactoring in the interest of cost efficiency.

Query & operator level metrics with accompanying visualizations in the query profile view provide visibility to understand opportunities for performance improvements (e.g., inefficient pruning, “exploding” joins, and identifying patterns in expensive queries).

In addition to the query profile view in the Snowflake UI, the get_query_operator_stats function can also provide these metrics.

Virtual warehouse configurations such as their size, and number of clusters provide the ability to balance concurrency, throughput, and cost in a manner that is best suited for the workload in question.

Furthermore, in many cases, it is possible to unlock superior price-performance through the judicious use of serverless services (such as query acceleration, automatic clustering, materialized views, search optimization, etc.) and/or Snowpark-optimized warehouses.
Snowpark-optimized warehouses help unlock ML training and memory-intensive analytics use cases, especially when using Snowflake’s secure Python/Java sandbox. They provide 16x more memory and 10x more local SSD cache per node compared to standard warehouses. The larger memory speeds up computations and larger local storage provides speedup when cached intermediate results and artifacts such as Python packages and JARs are reused on subsequent runs. Metrics exposed under the QUERY_HISTORY view such as BYTES_SPILLED_TO_LOCAL_STORAGE and BYTES_SPILLED_TO_REMOTE_STORAGE indicate the extent of memory pressure, which in many cases, can be addressed in a cost-efficient manner by moving to Snowpark-optimized warehouses of the same size.

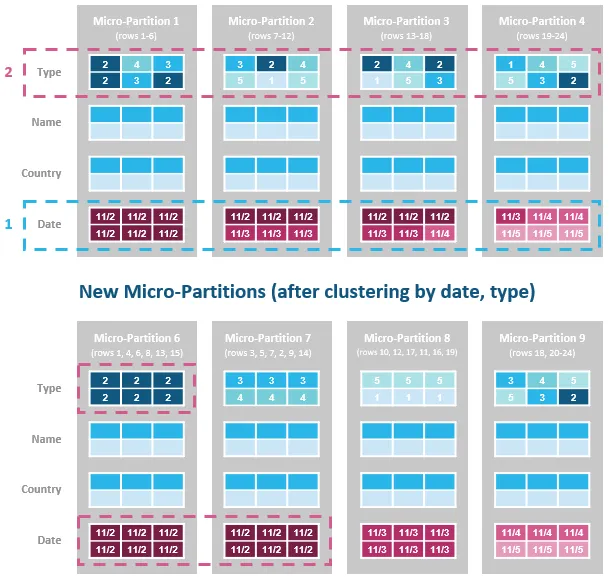
Automatic Clustering helps reorganize table data to align with query patterns to process only the relevant data from large tables, thereby speeding up queries which results in fewer compute credits. The pricing for auto clustering is based on credits for background clustering maintenance.
Materialized Views store frequently used projections and aggregations to avoid expensive re-computations resulting in faster queries, which results in lower spend. The results from Materialized Views are guaranteed to be up-to-date via asynchronous and incremental maintenance. The pricing is based on refreshes and additional storage.

Search Optimization Service makes it possible to quickly find “needles in the haystack” to return a small number of rows on large tables. It accelerates point lookup queries on all columns of supported types on large tables. This results in faster query performance on data exploration and filtering workloads, which can result in lower credit consumption.

Query Acceleration Service (QAS) provides elastic scale-out of compute and reduces query runtime without changing warehouse size. It runs alongside the existing warehouse to accelerate the scan & aggregation portions of queries in near real time. QAS compute resources billed per second. The SYSTEM$ESTIMATE_QUERY_ACCELERATION function and QUERY_ACCELERATION_ELIGIBLE View help identify queries that might benefit from QAS.

4/ Throttle/control resource allocation & scaling permissions
For sufficiently large and mature Snowflake use cases delivered via a central platform team, we recommend policies that restrict which users or teams can perform credit consuming operations such as warehouse creation, sizing, and scaling limits to control costs and reduce indeterminacy from unintended spend by additional users.
Snowflake provides the ability to set permissions to use, create, and modify credit consuming resources (such as warehouse creation, sizing, scaling limits, QAS scale factor, etc.) to control costs and reduce indeterminacy.
To limit the spend of workloads, virtual warehouse configurations such as its size, number of clusters, scaling policy, auto-suspend timeout, and statement timeouts for running and queuing directly place an upper bound on spend. When multi-cluster warehouses are used, the standard scaling policy optimizes for minimizing queuing over conserving credits — every successive cluster spin-up waits for at least 20 seconds. Alternatively, the economy scaling policy optimizes for conserving credits by keeping running clusters fully loaded; new clusters are spun up only if the system estimates there will be enough jobs to keep the cluster busy for at least 6 minutes.

Snowflake enables a “scale to zero” model with auto-suspend and auto-resume capabilities which are enabled by default. This capability turns warehouses off when they are idle, preventing paying for idle time and thus saves customers money. For use cases such as ELT and data loading which are unlikely to use query caching, the recommendation is to suspend warehouse immediately if idling. Use cases that take advantage of query caching (e.g., Business Intelligence, dash boarding) can benefit from longer suspend times.

Resource Monitors provide alerting and hard limits to prevent overspend via credit quotas for individual warehouses. When warehouses reach a limit a notification and/or suspension can be initiated. Resource monitors can also be set up on a schedule to track and control credit usage by virtual warehouses.

Resource monitors can help prevent certain warehouses from unintentionally consuming more credits than expected.

Query Acceleration scale factor sets an upper bound on the amount of compute resources a warehouse can lease for acceleration. The scale factor is a multiplier based on warehouse size and cost. For example, if the scale factor is 5 for a Medium-sized warehouse (4 credits/hour), the warehouse can lease compute up to 5 times its size (i.e., 4 * 5 = 20 credits/hour). By default, the scale factor is set to 8 when Query Acceleration Service is used.
Conclusion and recap
To recap, our best practices for optimizing costs on Snowflake are: 1/ Obtain visibility into cost & implement chargeback, 2/ Proactive Budgeting & Alerting, 3/ROI-based workload segmentation, and 4/ Throttle/control resource allocation & scaling permissions
To this effect, we’ve organized our investments into the following areas:

We are deeply committed to helping customers get the most return on their Snowflake credits and are working on an exciting roadmap of functionality to further this aim.
