How an oceanographer got “lost” in space
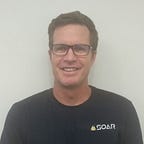
Valters Žeižis is an oceanographer from Riga, Latvia, a small country on the east coast of the Baltic sea where roughly 2 million people live on about 65,000 square kilometers of woodlands and agriculture. He currently lives in the United States with his wife and family. His professional duties include data collection, analysis, and interpretation, as well as public education and legal framework development and implementation in which he represents his organization and country in international organizations like WMO and IOC.
Since childhood, Valters has been inspired by tales of explorers and the maps that symbolize their travels. Mapping was a required skill and key source of information throughout his study of geography, geology, and geomatics. He began officially mapping in GIS about ten years ago, but he fondly recalls the abstract and imaginary maps he dreamed up as a kid and likes to think his mapping truly began then.
Maps are a key source of information for oceanographers. Bathymetry, wave height, current vectors, and other types of graphic information are expressed using various maps. Valters maps just about anything related to environmental data involving in-situ or remote observations, as well as statistical maps. As a hobby, he also enjoys experimenting with satellite data and open resource platforms such as Soar.
I like the idea of changing map scales. I think it’s borderline philosophy since it implies that the importance of any object or subject relies on the scope of your view. -Valters Žeižis
He pulls base layer imagery from OpenStreetMap and local governmental datasets and uses SNAP and QGIS for satellite data processing because they are both open access and have a wide range of additional functionality apart from basic mapping and analysis tools. He relies mainly on GIMP for image manipulation. There are other programs for spatial data viewing, manipulation, and modeling that he uses for specific tasks or tasks for which he is accustomed to using a specific program. For quick browsing and experiments, he enjoys the Sentinel Hub platform. Valters also mentioned his excitement about Sentinel 6, which will facilitate a global dataset of sea surface height and anomalies that allow us to detect changes that span decades and model the future.
Valters and colleagues have been exploring agricultural applications of satellite and UAV data gathering and postprocessing to produce crop type, density, development stage, and other derived information. Surface indices and other simple data have a lot to offer industries like insurance, spatial planning, and transport, as well.
With some knowledge of agriculture, a time series could provide indications of harvest forecast. A single image might show whether one plot has developed further than others at the given time. This image can also provide information on soil color, which can be indicative of properties like moisture and nutrient content. In this case, you can see locations on the plot where nutrients have been washed out or where the plot needs irrigation adjustments.
The correlation between satellite imagery and ground data currently has a wide breadth. There are many factors like cloud shadow and atmospheric effects that have to be processed to produce constant signal values. Valters believes we’ll be able to mitigate these issues in the near future by blending sources and improving atmospheric correction algorithms. He also believes we’re getting closer to agricultural equipment that can download and interpret the data on its own.
When asked about his resolution preferences, Valters described a “four-headed beast”. Radiometric, spectral, temporal, and spatial resolution will all affect the applications and limitations of data. General resolution discussions are typically centered around spatial resolution. It’s important to identify the objective and choose the appropriate resolution for the needed data. That said, Valters typically prefers data with moderate to high spatial resolution. Some sensors offer high resolution of all four types, but Valters believes significant breakthroughs in hi-res will be seen as the data becomes more open to everyone.
The Earth Observation community on Twitter is engaging and enthusiastic, which drew Valters to use his account to access literature and information on earth observation, remote sensing, and related subject, and share some of his images. However, the image sizes are limited, so it’s best for simple graphics. For larger images, detailed comparisons, and cloud storage, Valters can use the Soar platform, where he and other professionals find and share satellite images, drone images, and maps.
*All imagery provided in the article provided by Soar
The Soar platform continues to serve the needs drone image hungry consumers who are utilising drone images in news and media, construction, land management, resources, and many other critical industries. If you have a special technology use case challenge, the team at Soar is keen to assist and provide a solution. We monitor our SM feeds closely and are always quick to respond and reach out to our users and clients.
Find out more about Soar or follow us on our social media channels- Telegram | Instagram | Twitter | Facebook | LinkedIn | Podbean
