Asjad NaqviinThe Stata GuideA Guide to DataViz BooksA preview of some 20+ data visualization and infographic books and their unique points. Some must haves are also discussed!6d ago
Rosamund PearceinThe EconomistWhy you sometimes need to break the rules in data vizBest practices help us to avoid common pitfalls in data visualisation — but we shouldn’t follow them blindlyFeb 28, 20208
Alden Do RosarioinBootcampGenerating infographics using ChatGPT and Dall-E 3Step-by-step guide on how you can create beautiful infographics using ChatGPT Plus and Dall-E 3.Oct 22, 202310Oct 22, 202310
Erik NylundinMake Your Data SpeakVisualizing Inequality: Award-Winning Project on Carbon EmissionsHow the World’s Wealthiest Impact Our Carbon FootprintJul 8Jul 8
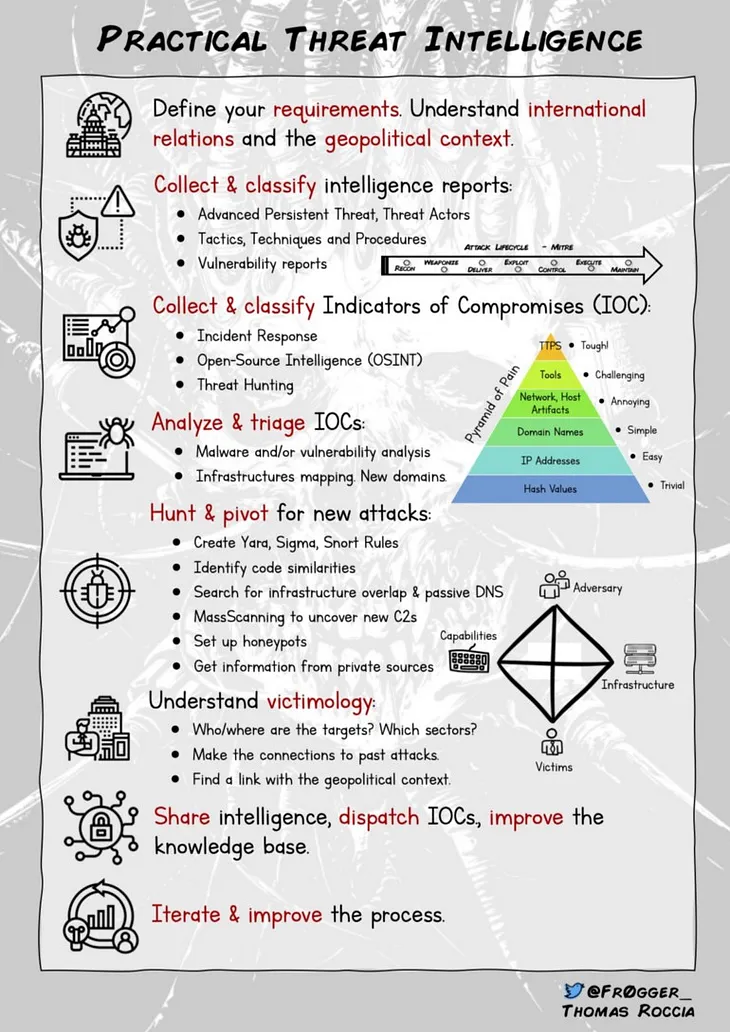
Thomas RocciainSecurityBreak6 Useful Infographics for Threat IntelligenceVisualizing Cybersecurity concepts can be a terrific way to learn more about specific tools, methodologies, and techniques! Here is a post…Dec 18, 20228Dec 18, 20228
Asjad NaqviinThe Stata GuideA Guide to DataViz BooksA preview of some 20+ data visualization and infographic books and their unique points. Some must haves are also discussed!6d ago
Rosamund PearceinThe EconomistWhy you sometimes need to break the rules in data vizBest practices help us to avoid common pitfalls in data visualisation — but we shouldn’t follow them blindlyFeb 28, 20208
Alden Do RosarioinBootcampGenerating infographics using ChatGPT and Dall-E 3Step-by-step guide on how you can create beautiful infographics using ChatGPT Plus and Dall-E 3.Oct 22, 202310
Erik NylundinMake Your Data SpeakVisualizing Inequality: Award-Winning Project on Carbon EmissionsHow the World’s Wealthiest Impact Our Carbon FootprintJul 8
Thomas RocciainSecurityBreak6 Useful Infographics for Threat IntelligenceVisualizing Cybersecurity concepts can be a terrific way to learn more about specific tools, methodologies, and techniques! Here is a post…Dec 18, 20228
AnyChartinData Visualization WeeklyRevealing Insights with Data Visualizations — DataViz WeeklyData visualizations bridge the gap between raw numbers & clear, understandable insights. Check out 4 remarkable examples on DataViz Weekly.Jun 14
KAPIL NARANGIndian Diaspora in the US: A Journey of Success and ContributionThe Indian diaspora in the United States is one of the most dynamic and influential immigrant communities in the country. With a population…Jul 8
Andrew MarcusinBootcampDesign of scatter plotsGuideline to designing scatter plots, a powerful infographic toolFeb 3, 20231