LaurenbmcguireCreating Stunning Visualizations with D3.js: A Step-by-Step GuideIn the age of big data, the ability to visualize complex datasets in an intuitive and interactive manner is invaluable. Enter D3.js, a…4d ago
Louise MoxyA simple way to make D3.js charts / SVG’s responsiveThis post will be a quick way to make any SVG or D3.js chart responsive.Oct 31, 20184
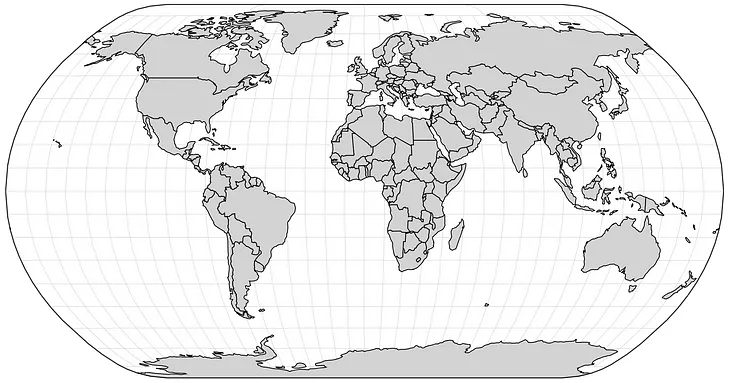
Amy De GenaroIntroduction to Digital Cartography: GeoJSON and D3.jsThere’s something so satisfying about organized data, particularly in the form of a great visualization. Coming from an Environmental…Aug 13, 20187Aug 13, 20187
AssiljanbeihBubble World Map drawing with D3| AngularWhen deciding to set bubbles on map, you’ll find many resources during the R&D process. Some might be free while others may cost a fortune.Nov 30, 20231Nov 30, 20231
LaurenbmcguireCreating Stunning Visualizations with D3.js: A Step-by-Step GuideIn the age of big data, the ability to visualize complex datasets in an intuitive and interactive manner is invaluable. Enter D3.js, a…4d ago
Louise MoxyA simple way to make D3.js charts / SVG’s responsiveThis post will be a quick way to make any SVG or D3.js chart responsive.Oct 31, 20184
Amy De GenaroIntroduction to Digital Cartography: GeoJSON and D3.jsThere’s something so satisfying about organized data, particularly in the form of a great visualization. Coming from an Environmental…Aug 13, 20187
AssiljanbeihBubble World Map drawing with D3| AngularWhen deciding to set bubbles on map, you’ll find many resources during the R&D process. Some might be free while others may cost a fortune.Nov 30, 20231
Ian JohnsonThe Hitchhiker’s Guide to d3.jsThe landscape for learning d3 is rich, vast and sometimes perilous. You may be intimidated by the long list of functions in d3’s API…May 12, 201713
Michael FaresHow I made an SVG Islamic Tessellation Coloring App with d3.js and ReactHey there fellow curious minded devs! It’s been a while since I’ve written a blog post and seeing as my New Year’s resolution for 2024 is…Dec 28, 2023