Vishwas RCreating Custom Range-Step Area Charts in CanvasJSCanvasJS is a JavaScript charting library that can be used for creating dynamic and interactive charts. Although it doesn’t have a built-in…2d ago
Guillaume WeingertnerinTowards Data Science5 Steps to Build Beautiful Stacked Area Charts with PythonHow to use the full capabilities of Matplotlib to tell a more compelling storyJan 134
Oyesina oyerinde AnuoluwapoTableau Saturday XXI, 6th July, 2024Our sole mission is to help people see and understand data.5d ago5d ago
ArjunAmrutiyaCrafting Dynamic Area Charts in Laravel Using Chart.js: A Step-by-Step GuideIntroduction: Area charts provide a visually appealing way to represent cumulative data trends. In this tutorial, we’ll guide you through…Nov 25, 2023Nov 25, 2023
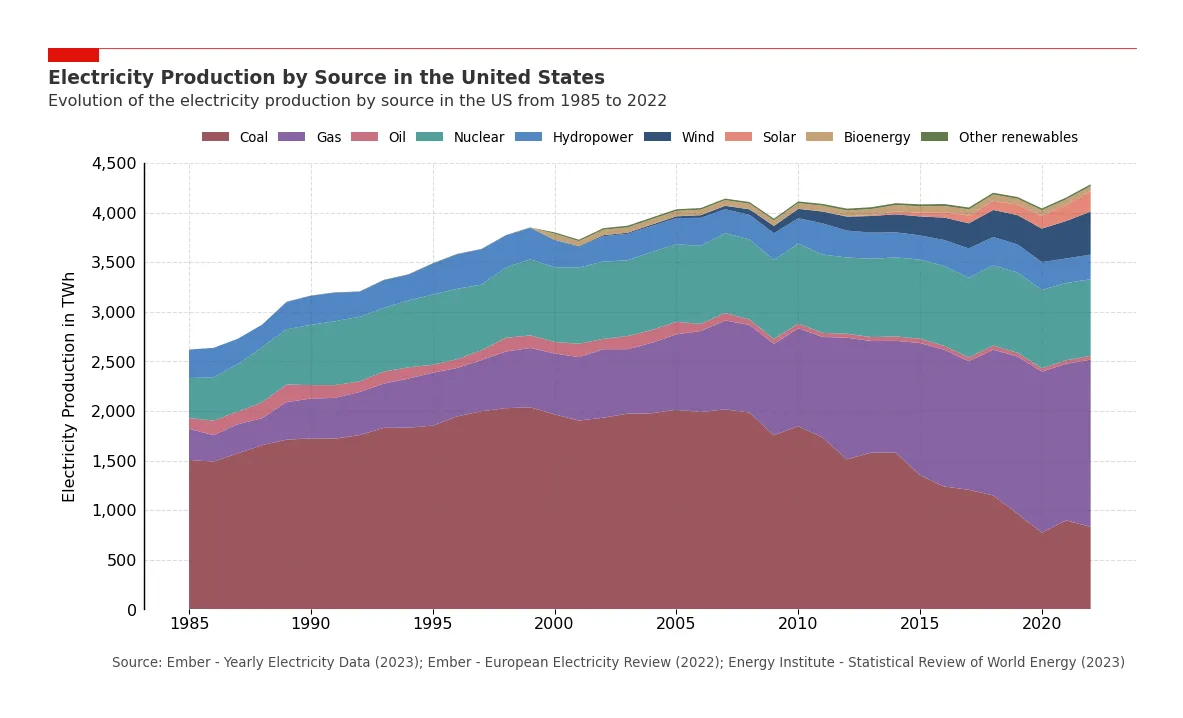
AdrianGraphics We Live By - Part IV: Area ChartsAn area chart or area graph (see A) is a graphical representation of quantitative data based on a line chart for which the areas between…May 22May 22
Vishwas RCreating Custom Range-Step Area Charts in CanvasJSCanvasJS is a JavaScript charting library that can be used for creating dynamic and interactive charts. Although it doesn’t have a built-in…2d ago
Guillaume WeingertnerinTowards Data Science5 Steps to Build Beautiful Stacked Area Charts with PythonHow to use the full capabilities of Matplotlib to tell a more compelling storyJan 134
Oyesina oyerinde AnuoluwapoTableau Saturday XXI, 6th July, 2024Our sole mission is to help people see and understand data.5d ago
ArjunAmrutiyaCrafting Dynamic Area Charts in Laravel Using Chart.js: A Step-by-Step GuideIntroduction: Area charts provide a visually appealing way to represent cumulative data trends. In this tutorial, we’ll guide you through…Nov 25, 2023
AdrianGraphics We Live By - Part IV: Area ChartsAn area chart or area graph (see A) is a graphical representation of quantitative data based on a line chart for which the areas between…May 22
Reethika MoovendhaninBold BITransforming Web Traffic Analysis with Area Charts | Bold BIUnlock key insights into website traffic patterns using powerful area charts. Optimize your online presence with data-driven analysis.Nov 29, 2023
Enos Otieno JumainBold BIBeyond Lines: Spline Area Charts for Insightful Data Visualization | Bold BIExplore the power of spline area charts to illuminate deep data insights. Discover trends beyond just lines with our comprehensive guide.Apr 24