Tom WolferMy Excel Automation TemplatesI’ve seen this interesting article, and, I thought I would share some spreadsheet automation tasks that I don’t know are possible in Knime…Dec 2
InThe Stata GallerybyAdam Ross NelsonChoosing A Data Visual By Function Type — Stata EditionWhich-Chart-When, The Functional Approach For Stata UsersDec 12, 2023
Crystal XStatistics interview question: When should one use a box plot instead of a histogram?Graphics are a very important part of preparing a statistical analysis. It is easier for an analyst to quickly decipher a visual…Nov 7Nov 7
Ricardo García Ramírez100 days of Data Science: Day 57 — Advanced Plotting Techniques: Contour Plots and Box PlotsIn today’s post, we’ll dive into creating contour plots and box plots using Matplotlib and Seaborn.Oct 28Oct 28
Ebrahim MousaviMatplotlib: Part 3. Exploring Different Plot TypesUnleashing the Power of Visualization through Varied Charting TechniquesAug 13Aug 13
Tom WolferMy Excel Automation TemplatesI’ve seen this interesting article, and, I thought I would share some spreadsheet automation tasks that I don’t know are possible in Knime…Dec 2
InThe Stata GallerybyAdam Ross NelsonChoosing A Data Visual By Function Type — Stata EditionWhich-Chart-When, The Functional Approach For Stata UsersDec 12, 2023
Crystal XStatistics interview question: When should one use a box plot instead of a histogram?Graphics are a very important part of preparing a statistical analysis. It is easier for an analyst to quickly decipher a visual…Nov 7
Ricardo García Ramírez100 days of Data Science: Day 57 — Advanced Plotting Techniques: Contour Plots and Box PlotsIn today’s post, we’ll dive into creating contour plots and box plots using Matplotlib and Seaborn.Oct 28
Ebrahim MousaviMatplotlib: Part 3. Exploring Different Plot TypesUnleashing the Power of Visualization through Varied Charting TechniquesAug 13
andvsilvaUnderstanding Data Distribution with Box Plots: A Practical IntroductionIntroduction to Box PlotsSep 19
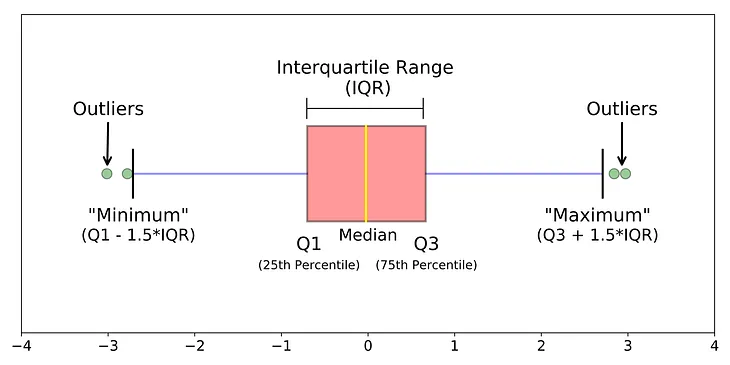
Vishal AgarwalOutlier detection with BoxplotsIn descriptive statistics, a box plot or boxplot is a method for graphically depicting groups of numerical data through their quartiles…Nov 30, 2019
Mehmet Ali TOROutlier Analysis Methods In Machine LearningHello, in this article, I talked about how to detect outliers in our data sets and the analysis processes we can do for these values.Sep 8