KavengikGovernment AI Readiness Index 2023: visualizing the infrastructure dimensionPreviously, we leveraged choropleth maps and other visualizations in ggplot2 to draw insights on AI talent using data from the 2023…Jul 5
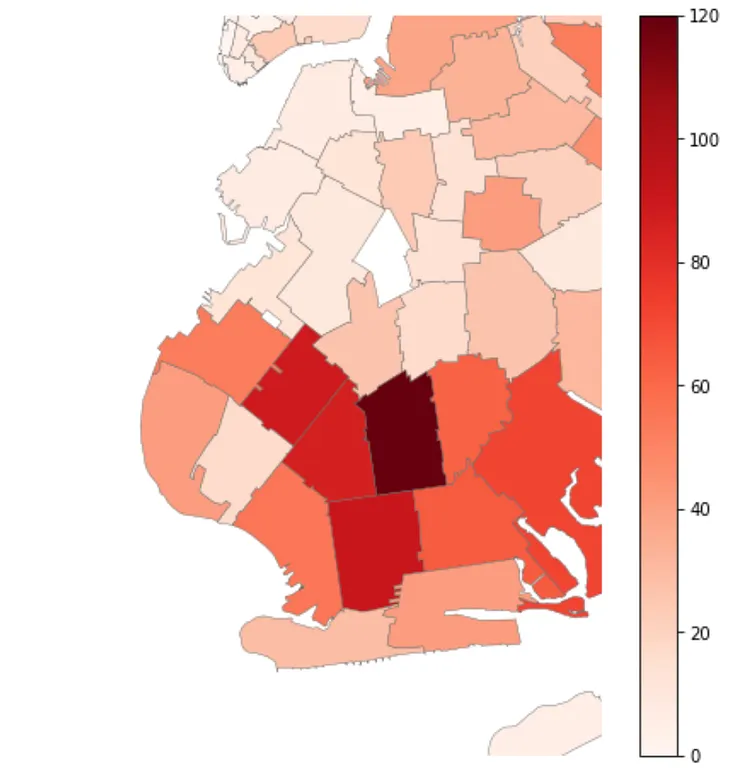
Mm FuenteslopezUsing plotly.express to make ZIP Code-level choropleth mapsChoropleth maps are a popular tool for visualizing geospatial data. Some of my favorite choropleth maps were used to display crime rates in…Apr 7, 20221
Drew SeewaldClean Maps in Python with GeopandasTricks for easy to read, production quality mapsJun 26Jun 26
Alex MitraniinTowards Data ScienceCreating Choropleth Maps with Python’s Folium LibraryHow to make choropleths with different data structures in PythonJun 16, 20221Jun 16, 20221
KavengikGovernment AI Readiness Index 2023: visualizing AI talent using ggplot2In the previous article, we leveraged choropleth maps and other visualizations in ggplot2 to draw insights on AI governance using data from…Jun 21Jun 21
KavengikGovernment AI Readiness Index 2023: visualizing the infrastructure dimensionPreviously, we leveraged choropleth maps and other visualizations in ggplot2 to draw insights on AI talent using data from the 2023…Jul 5
Mm FuenteslopezUsing plotly.express to make ZIP Code-level choropleth mapsChoropleth maps are a popular tool for visualizing geospatial data. Some of my favorite choropleth maps were used to display crime rates in…Apr 7, 20221
Drew SeewaldClean Maps in Python with GeopandasTricks for easy to read, production quality mapsJun 26
Alex MitraniinTowards Data ScienceCreating Choropleth Maps with Python’s Folium LibraryHow to make choropleths with different data structures in PythonJun 16, 20221
KavengikGovernment AI Readiness Index 2023: visualizing AI talent using ggplot2In the previous article, we leveraged choropleth maps and other visualizations in ggplot2 to draw insights on AI governance using data from…Jun 21
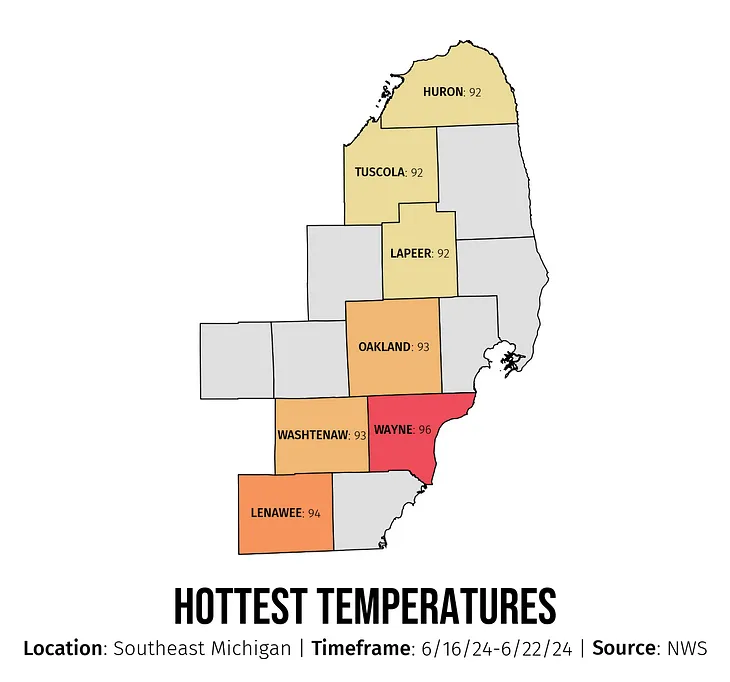
Benjamin SpilsburyinTowards Data ScienceMaking Heat Maps with Literal Maps: How to Use Python to Construct a ChloroplethHave you ever been reading a news article where, halfway down the page, you come across a beautiful graphical representation of whatever…Oct 5, 20201
KavengikGovernment AI Readiness Index 2023: visualizing governance insights using ggplot2In the previous article, we leveraged choropleths map in ggplot2 to visualize AI readiness scores using data from the 2023 Government AI…Jun 5
Burger WuinGeek CultureThree Ways to Plot Choropleth Map Using PythonChoropleth map is a exceptional choice for presenting geo spatial data. In this article, we will introduce you three methods for plotting…Apr 5, 20212