InDigital Global TravelerbyHaniExploring The Beauty Of Hagley ParkHagley Park is a park located in Christchurch, New Zealand which is a complimentary park for everyone to visit.Nov 21
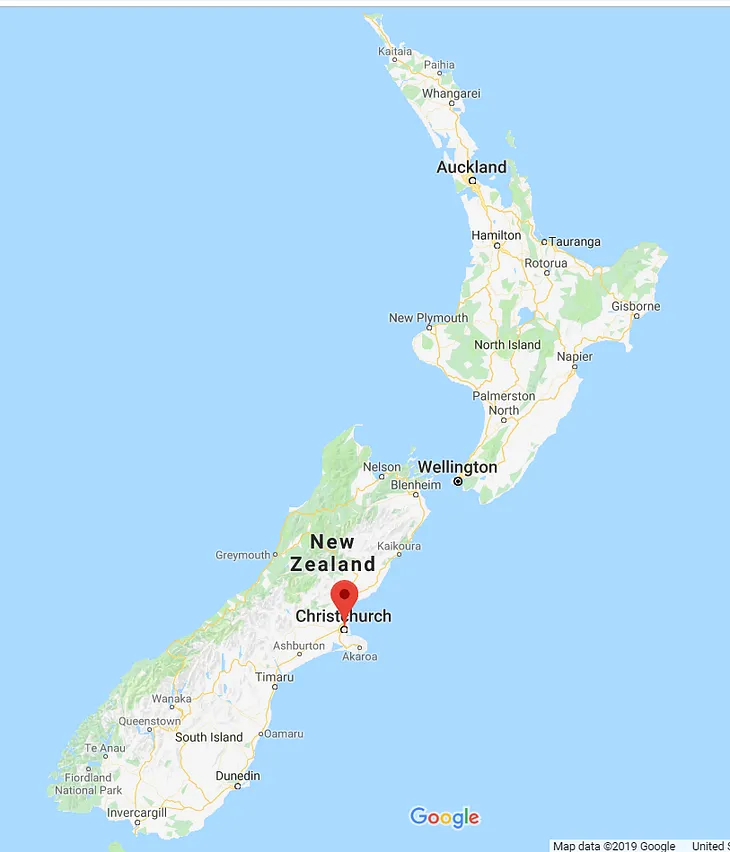
InGlobetrottersbyTim Ward, Mature FlâneurAfter the Quake: Christchurch ResurrectedNew Zealand’s second city gets a rebootSep 30, 202311
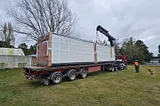
Portable DwellingsWhat You Can Expect from an Affordable Portable HomeIn recent years, affordable portable homes have gained much popularity as many people nowadays look for flexibility, sustainability, and…2d ago2d ago
InDigital Global TravelerbyHaniExploring Attraction In Christchurch (NZ): Willowbank Wildlife ReserveI was in dilemma whether to choose Orana Wildlife Reserve or Willowbank Wildlife Reserve, but I am glad I chose Willowbank Wildlife…Nov 125Nov 125
InArc DigitalbyJustin LeeThe Christchurch Terrorist’s Strategy for White RadicalizationThe shooter wrote a script. Don’t act it out.Mar 18, 20194Mar 18, 20194
InDigital Global TravelerbyHaniExploring The Beauty Of Hagley ParkHagley Park is a park located in Christchurch, New Zealand which is a complimentary park for everyone to visit.Nov 21
InGlobetrottersbyTim Ward, Mature FlâneurAfter the Quake: Christchurch ResurrectedNew Zealand’s second city gets a rebootSep 30, 202311
Portable DwellingsWhat You Can Expect from an Affordable Portable HomeIn recent years, affordable portable homes have gained much popularity as many people nowadays look for flexibility, sustainability, and…2d ago
InDigital Global TravelerbyHaniExploring Attraction In Christchurch (NZ): Willowbank Wildlife ReserveI was in dilemma whether to choose Orana Wildlife Reserve or Willowbank Wildlife Reserve, but I am glad I chose Willowbank Wildlife…Nov 125
InArc DigitalbyJustin LeeThe Christchurch Terrorist’s Strategy for White RadicalizationThe shooter wrote a script. Don’t act it out.Mar 18, 20194
Keith WestwaterHow I became a Snow SayerFrozen rain and lines on maps — a poem and photo essayAug 201
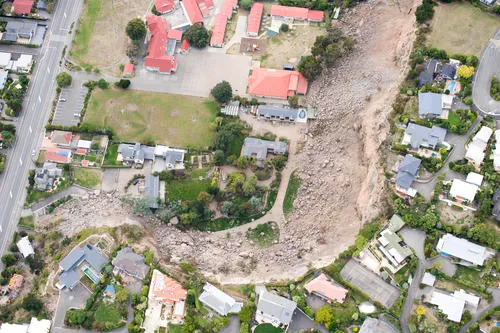
Amanda Gostomski2011 Christchurch Earthquake — through the perspective of a childOn a February morning when I was six years old, I left for school, excited to go to the first choir practice of the year. When I returned…Nov 21, 2022
InNJPW GlobalbyNew Japan Pro-WrestlingIte Lemalu’s TAMASHII focus: Christchurch’s prospectsIte Lemalu looks at New Zealand’s promising prospectsJul 24