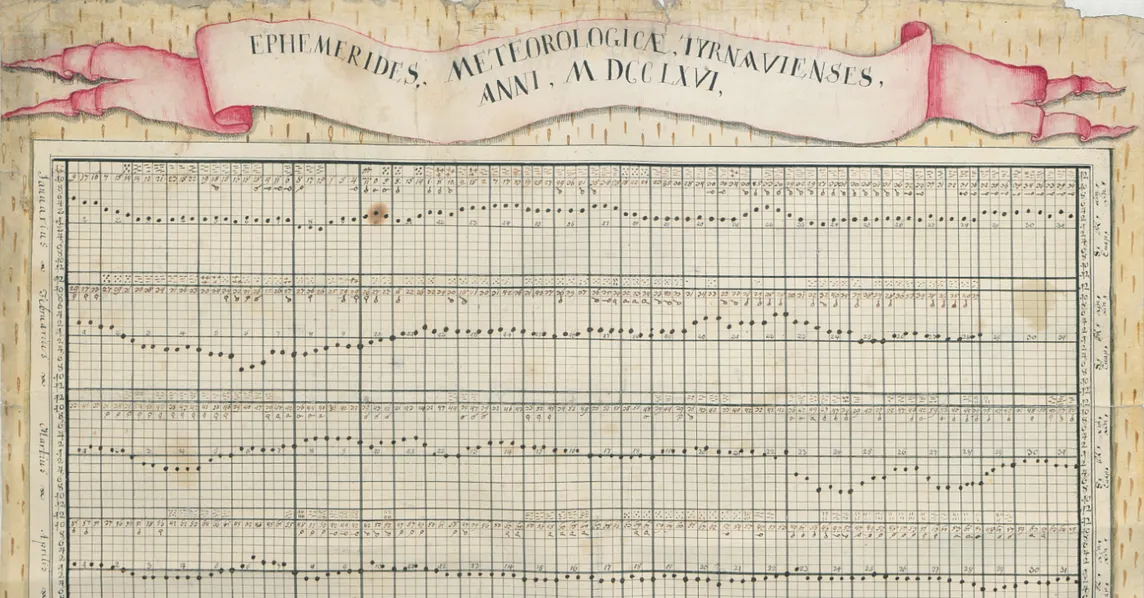
Attila BátorfyinNightingaleNotes on Two Mid-18th Century Meteorological ChartsThe (probably) earliest charts in Hungary and their possible Dutch inspirationMay 13, 20211
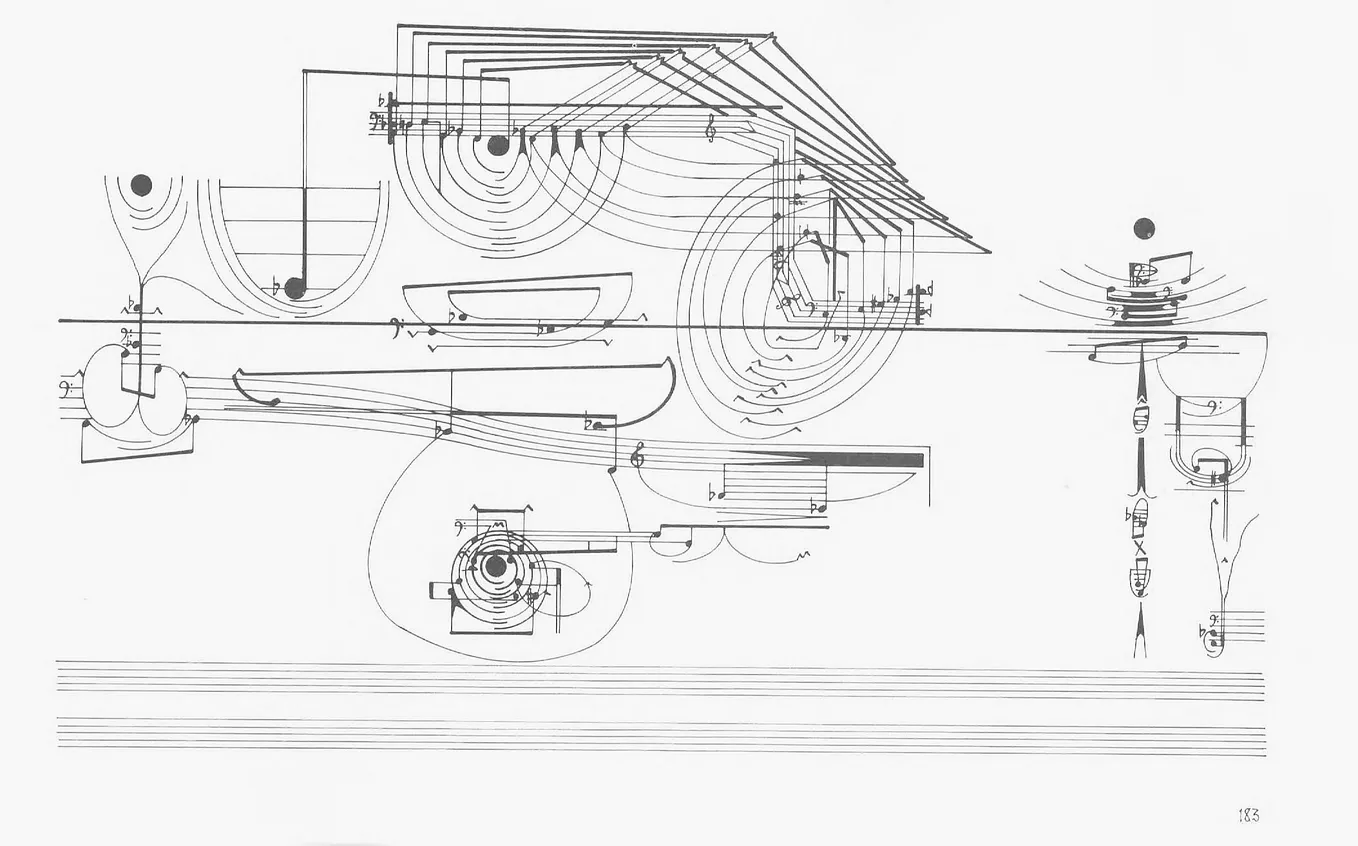
Jason ForrestinNightingaleTreatise: A Visual Symphony Of Information DesignWhy Cornelius Cardew’s legendary 193-page graphic score might not actually be about music.Oct 9, 20192
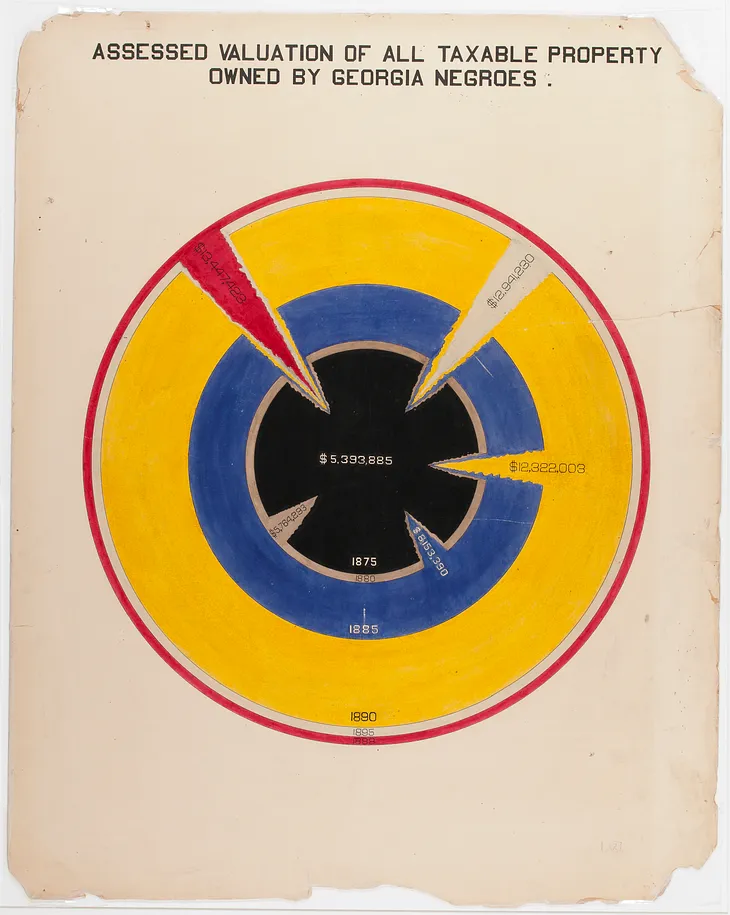
Jason ForrestinNightingaleW. E. B. Du Bois' staggering Data Visualizations are as powerful today as they were in 1900 (Part…Made by an all-black team 118 years ago - only 37 years after the end of slavery.Jul 19, 20184Jul 19, 20184
Jason ForrestinNightingaleThe Influence of Isotype in New Deal Information Design: A Resettlement Administration ExhibitionHow the design concept influenced the American governments campaign to help its vulnerable populations.Oct 15, 20202Oct 15, 20202
Jason ForrestinNightingaleExploring the Craft and Design of W.E.B. Du Bois' Data Visualizations (Part 3)Exploring the craft and historical significance of Du Bois' unique and innovative charts for the 1900 Paris Exposition.Aug 23, 20182Aug 23, 20182
Attila BátorfyinNightingaleNotes on Two Mid-18th Century Meteorological ChartsThe (probably) earliest charts in Hungary and their possible Dutch inspirationMay 13, 20211
Jason ForrestinNightingaleTreatise: A Visual Symphony Of Information DesignWhy Cornelius Cardew’s legendary 193-page graphic score might not actually be about music.Oct 9, 20192
Jason ForrestinNightingaleW. E. B. Du Bois' staggering Data Visualizations are as powerful today as they were in 1900 (Part…Made by an all-black team 118 years ago - only 37 years after the end of slavery.Jul 19, 20184
Jason ForrestinNightingaleThe Influence of Isotype in New Deal Information Design: A Resettlement Administration ExhibitionHow the design concept influenced the American governments campaign to help its vulnerable populations.Oct 15, 20202
Jason ForrestinNightingaleExploring the Craft and Design of W.E.B. Du Bois' Data Visualizations (Part 3)Exploring the craft and historical significance of Du Bois' unique and innovative charts for the 1900 Paris Exposition.Aug 23, 20182
Mary AvilesinNightingaleA Virtual Guided Tour of ‘Data Visualization and the Modern Imagination’The new exhibit at the Stanford Library explores the long and innovative history of data visualizationOct 2, 20201
Ben JonesinNightingaleCredit Where Credit is Due: Mary Eleanor SpearExploring the life and work of an overlooked mid-century dataviz pioneer who may have discovered the Box Plot 17 years before John Tukey.Aug 6, 20193
Paul KahninNightingaleTouching MinardAn examination of the original diagrams by Charles-Joseph Minard, and related materials by Léon Lalanne and Émile Cheysson in the ENPC…Jun 1, 20202