Ricardo García Ramírez100 days of Data Science: Day 19 — Creating Pivot Tables in PandasPivot tables allow you to summarize, reorganize, and flexibly explore your data3d ago3d ago
Anwesha BhattacharyaPivot Table, Pivot Chart &Power Pivot: (VLOOKUP & DAX)A PivotTable in Excel is a tool that summarizes, analyzes, and calculates data to help you spot patterns, trends, and comparisons. It’s a…5d ago5d ago
Lucy Njeri MuturiinSyncfusionStreamline Data Management with Inline Editing in Angular Pivot TableLet’s see how to implement and customize inline editing in the Syncfusion Angular Pivot Table with code examples.6d ago6d ago
Alice YangCreate, Update, and Remove Pivot Tables in Excel with PythonPivot tables are one of Excel’s most powerful features that allow users to quickly summarize, analyze, and visualize data. Whether you’re…Sep 11Sep 11
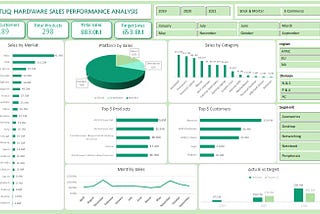
Mahalak4401Optimizing Sales Performance: Key Metrics and Insights with a Finance DashboardIn today’s fast-paced business environment, having a clear and comprehensive view of sales performance is crucial. Among the most critical…Sep 5Sep 5
Lucy Njeri MuturiinSyncfusionOptimize Performance: Choose the Best Data Source for Pivot TableDiscover how to choose the right data source for Syncfusion Pivot Table, ensuring optimal performance and usability.Sep 3Sep 3
Steve SohcotElevate Your Pivot Tables: The Secret to Adding a Calculated Item in ExcelLearn how to add a calculated item in Excel pivot tables to create dynamic, custom columns like a Delta. Perfect for advanced Excel users!Sep 31Sep 31
Mahalak4401Sales Strategy with Real-Time Dashboard Insights with MS ExcelWelcome to a Sales Strategy with Real-Time Dashboard Insights with Microsoft Excel! Proceed-through the step-by-step process to create an…Aug 30Aug 30
Crystal XYouTube Video Review: Excel Data Analysis Full TutorialI use Excel in my day job quite a bit. I am quite often tasked with preparing a report or chart in Excel, and lack of skill in a certain…Aug 26Aug 26